Monitoring Overview
Monitoring can be categorized into two main areas:
On-chain
This involves tracking events that occur on the blockchain. Examples include:
- Transactions by specific addresses
- Changes in the validator set
On-chain monitoring typically involves checking blockchain data via RPC nodes to assess values, delays, and the timing of events. It is recommended to run your own RPC servers to avoid potential issues with public RPC nodes. There are useful tools such as Polkabot and Polkadot-Basic-Notification to help with on-chain monitoring.
On-Host
On-host monitoring involves tracking the individual node itself. Examples include:
- Current block height
- Number of peer-to-peer (P2P) connections
- Finality lag
To monitor individual node, polkadot-sdk binary exposes metrics in a Prometheus type format at http://host:9615/metrics. By default, this endpoint is only exposed on the local network interface, but you can expose it on all interfaces using the --prometheus-external flag.
As the metrics provided by these endpoints don't include hosts metrics (e.g. CPU, memory, bandwidth usage), it is recommended to complement it with other tools such as Prometheus node exporter which needs to be installed on the same host.
Monitoring Stack
Polkadot tools
- polkadot-introspector: The Polkadot Introspector is a collection of tools for monitoring and introspection of Polkadot or other substrate-based blockchains.
- polkadot-telemetry: The telemetry server is used for real time information from nodes, showing information about their name, location, current best & finalized blocks, and others. It gives a useful dashboard to view the state of nodes. An example of live running Telemetry site is https://telemetry.polkadot.io/
Non-Polkadot specific tools
The recommended Polkadot monitoring stack consists of the following tools:
- Prometheus: A systems and service monitoring system based on a timeseries database.
- Grafana: allows you to query, visualize, and understand your metrics.
- Alertmanager: Creates and routes alerts to the tool of your choice (Email / SMS / Telegram / PagerDuty / Slack / Matrix) based on alert rules and metrics
- Loki - A highly scalable log aggregation system that allows you to view and search logs from all your infrastructure in one place.
For available set of Polkadot dashboards, alerts and rules are listed in polkadot-monitoring-mixin repository.
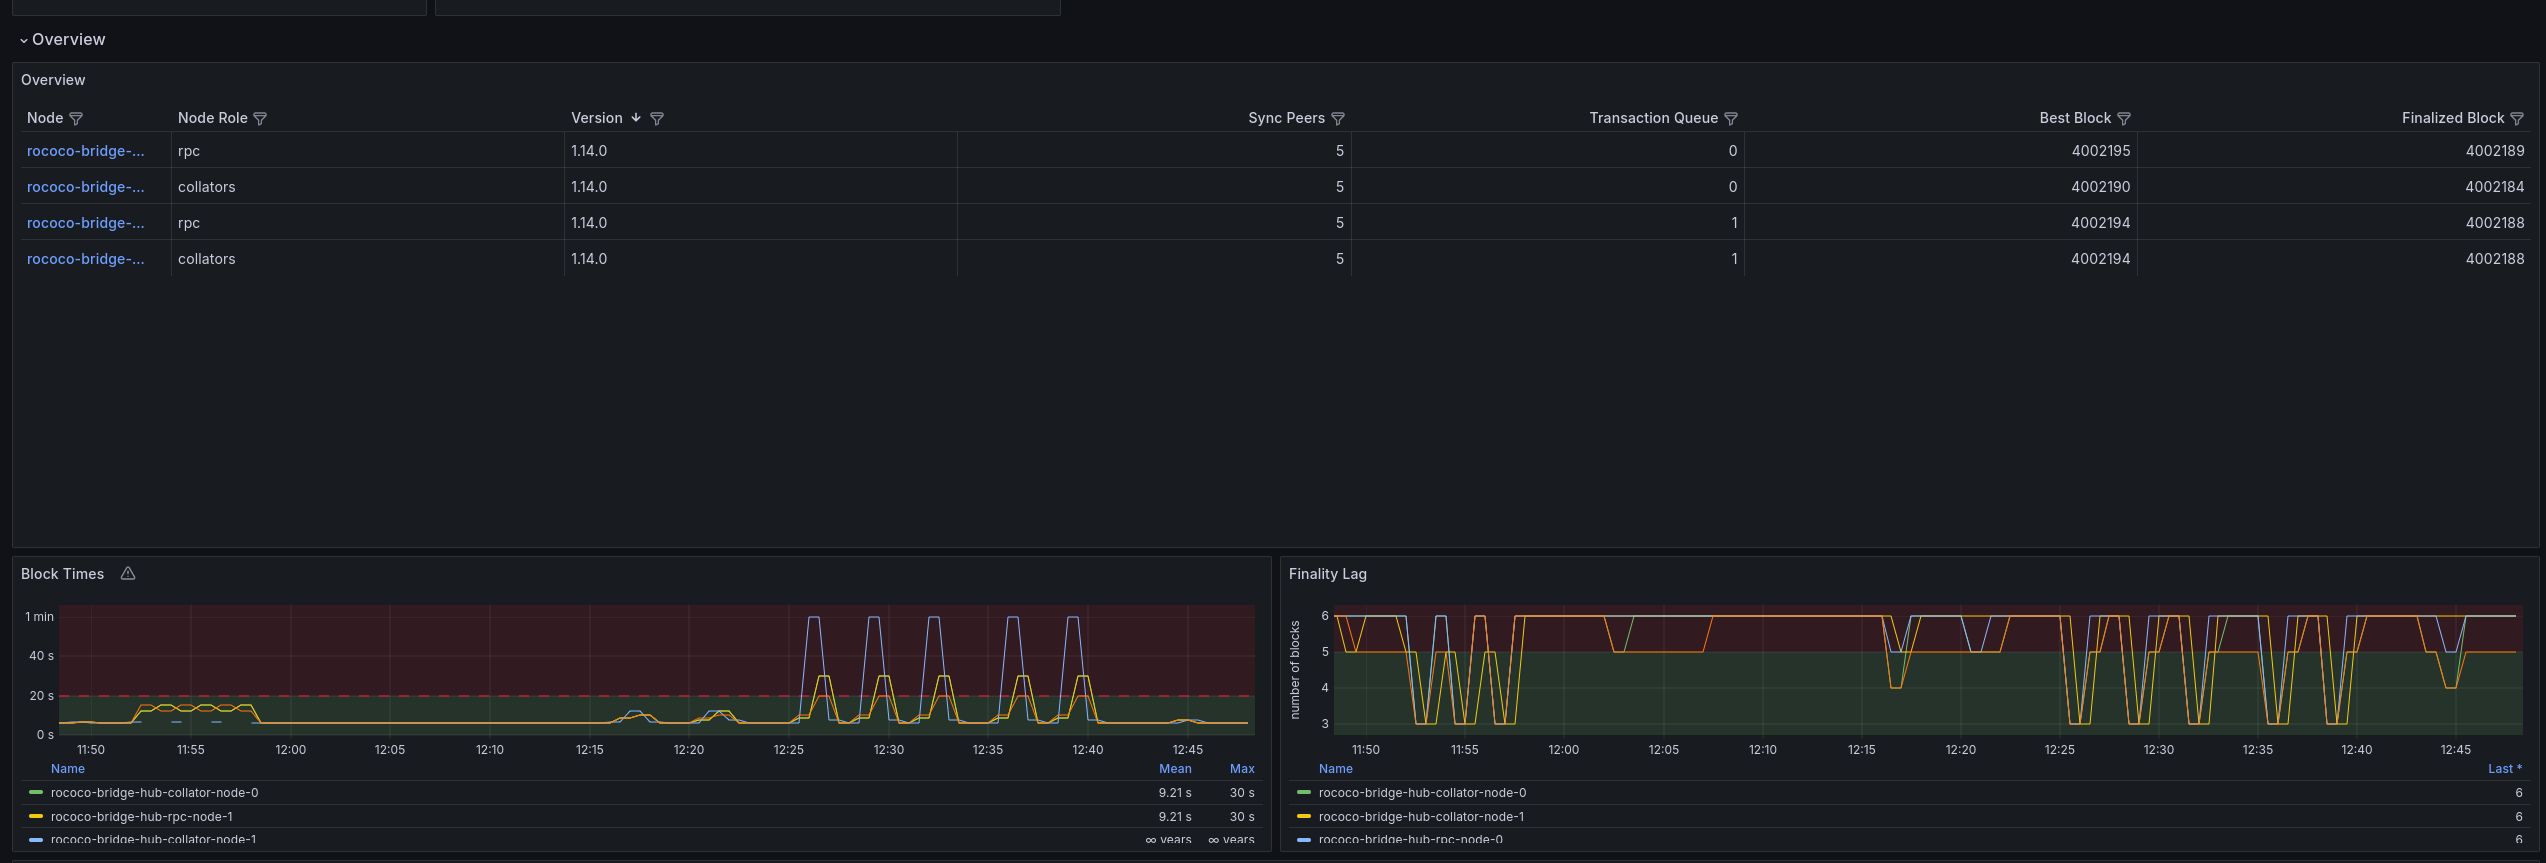
An example of the metric dashboard from polkadot-monitoring-mixin: