Overview
This guide contains the following sections:
- How-to guides: Getting started with specific use case, eg. deploying a parachain network.
- Explanations: Explanations of concepts and configurations relevant to Polkadot blockchain infrastructure.
- References: Index of useful links and tools.
Subkey
subkey is a cli tool for generating substrate based account. It can also be used for signing and verifying messages, but in this doc we only cover account creation and node key (libp2p) generation.
Installation
In order to install the tool, please reference the substrate documentation: https://docs.substrate.io/reference/command-line-tools/subkey/#installation
Generate Substrate Based Accounts
As mentioned earlier, subkey can be used to generate accounts for different substrate chains and parachains, including polkadot, kosama, moonbeam, etc.
By default, substrate generate command generate an account for substrate network. By adding --network <network-name>, one could generate accounts for other networks.
> subkey generate
Secret phrase:       claim year obvious artist also float royal vague industry tackle husband prize
  Network ID:        substrate
  Secret seed:       0x4548be7dc2fa89b3e5600f3933d69ffac4d06e0ac6222ccb9a17fe3cb49ebd9d
  Public key (hex):  0x10938f06b4265ac2bef65bc5d3e3d8ce20b12bc07d2d45ca1463ba2f1a47a078
  Account ID:        0x10938f06b4265ac2bef65bc5d3e3d8ce20b12bc07d2d45ca1463ba2f1a47a078
  Public key (SS58): 5CSSTUxjWVAWSLDxigjsyAF2PXLCznf1FSUhbDooTwaaWQM1
  SS58 Address:      5CSSTUxjWVAWSLDxigjsyAF2PXLCznf1FSUhbDooTwaaWQM1

> substrate generate --network polkadot
Secret phrase:       spell subject sleep celery cigar term neck tube blossom inflict session baby
  Network ID:        polkadot
  Secret seed:       0x50893f76f50855f9ca891dfa55ef64f51ad744f3d643f3f8046ef13b6b249baa
  Public key (hex):  0x847ace070b6bb193659379f1c64e8f3dda721ba545bfaee6fbb717df84ef247f
  Account ID:        0x847ace070b6bb193659379f1c64e8f3dda721ba545bfaee6fbb717df84ef247f
  Public key (SS58): 13zhoUzf3rqj5uzgFAuquf7DrgofKrUHBjUemarXS78G4Bon
  SS58 Address:      13zhoUzf3rqj5uzgFAuquf7DrgofKrUHBjUemarXS78G4Bon
- The seed phrase must be saved and stored in a safe place to be able to recover your account information (public and private keys).
- The
SS58 Addressis the account address on different network (aka wallet address). - The
Network IDfield indicate the network name that this account belongs to.
Retrieve Accounts From the Seed Phrase
subkey inspect subcommand can be used to retrieve the account information from the seed phrase:
> subkey inspect "claim year obvious artist also float royal vague industry tackle husband prize"
Secret phrase:       claim year obvious artist also float royal vague industry tackle husband prize
  Network ID:        substrate
  Secret seed:       0x4548be7dc2fa89b3e5600f3933d69ffac4d06e0ac6222ccb9a17fe3cb49ebd9d
  Public key (hex):  0x10938f06b4265ac2bef65bc5d3e3d8ce20b12bc07d2d45ca1463ba2f1a47a078
  Account ID:        0x10938f06b4265ac2bef65bc5d3e3d8ce20b12bc07d2d45ca1463ba2f1a47a078
  Public key (SS58): 5CSSTUxjWVAWSLDxigjsyAF2PXLCznf1FSUhbDooTwaaWQM1
  SS58 Address:      5CSSTUxjWVAWSLDxigjsyAF2PXLCznf1FSUhbDooTwaaWQM1

> subkey inspect --network polkadot "spell subject sleep celery cigar term neck tube blossom inflict session baby"
Secret phrase:       spell subject sleep celery cigar term neck tube blossom inflict session baby
  Network ID:        polkadot
  Secret seed:       0x50893f76f50855f9ca891dfa55ef64f51ad744f3d643f3f8046ef13b6b249baa
  Public key (hex):  0x847ace070b6bb193659379f1c64e8f3dda721ba545bfaee6fbb717df84ef247f
  Account ID:        0x847ace070b6bb193659379f1c64e8f3dda721ba545bfaee6fbb717df84ef247f
  Public key (SS58): 13zhoUzf3rqj5uzgFAuquf7DrgofKrUHBjUemarXS78G4Bon
  SS58 Address:      13zhoUzf3rqj5uzgFAuquf7DrgofKrUHBjUemarXS78G4Bon
Derived Accounts (Child Accounts)
The subkey programs supports creation of sub accounts which are derived from the exact same seed phrase, so that there'd be no need for additional seed phrases for new accounts. One use case is when you want to create multiple accounts for different validators/collators, without needing to create and store many seed phrases.
To derive a child key pair, you add two slashes (//), a derivation path, and an index after the secret phrase associated with its parent key. Because you derive child key pairs and addresses from keys that have been previously generated, you use the subkey inspect command. For example:
> subkey inspect "claim year obvious artist also float royal vague industry tackle husband prize//validator-1//beefy"
  Network ID:        substrate
  Secret seed:       0xb60b7b15155936780cd83063e169bc8402276b253a1d75fa678cc547dd530eb2
  Public key (hex):  0x269c50d4065b4bf58839df4cfc16a11b367b80fbf00d21a96da863d8659e720a
  Account ID:        0x269c50d4065b4bf58839df4cfc16a11b367b80fbf00d21a96da863d8659e720a
  Public key (SS58): 5CwL7TsLnqQKakTfweh5aZ27fe9GHySP86YwbHtLUK3p649g
  SS58 Address:      5CwL7TsLnqQKakTfweh5aZ27fe9GHySP86YwbHtLUK3p649g


> subkey inspect "claim year obvious artist also float royal vague industry tackle husband prize//validator-1//babe"
  Network ID:        substrate
  Secret seed:       0xb31ee2df80a708917b62683579164f625be935a4c3760b24cd3f60f630e0ee2e
  Public key (hex):  0x00493534063762b76cb4ffad8336e57af312c02a6155a871600040de6f1d936a
  Account ID:        0x00493534063762b76cb4ffad8336e57af312c02a6155a871600040de6f1d936a
  Public key (SS58): 5C55c1YcFWQV6XdFCQVpG52K1SjgZqWKDvg7uNe9PFX4Hc9x
  SS58 Address:      5C55c1YcFWQV6XdFCQVpG52K1SjgZqWKDvg7uNe9PFX4Hc9x
Important Note: Both seed phrase and derivation paths need to be stored to be able to arrive at the key for an address. Only use custom derivation paths if you are comfortable with your knowledge of this topic.
Generate Node Keys (libp2p Keys)
Use the subkey generate-node-key command to generate random public and private keys for peer-to-peer (libp2p) communication between Substrate nodes. The public key is the peer identifier that is used in chain specification files or as a command-line argument to identify a node participating in the blockchain network. In most cases, you run this command with a command-line option to save the private key to a file.
To generate a random key pair for peer-to-peer communication and save the secret key in a file, run a command similar to the following:
> subkey generate-node-key --file ../generated-node-key
12D3KooWMUsb8yizAaQiFRPtuqJTK9c7CSektH5YFV3MGxHGJbnV
This command displays the peer identifier for the node key in the terminal and the private key is saved in the generated-node-key file. In this example, the saved key in the parent directory instead of the current working directory.
12D3KooWHALHfL7dDBiGTt4JTEAvCbDWts8zHwvcPvJXDF9fxue7
Use the subkey inspect-node-key command to display the peer identifier for the node that corresponds with the node key in the specified file name. Before using this command, you should have previously used the subkey generate-node-key command and saved the key to a file.
> subkey inspect-node-key --file <file-name>
How-to Guides
This section provides useful guides for getting started with Polkadot infrastructure.
Guide: Deploying a Parachain Network
This guide demonstrates the deployment of a parachain test network composed of 2 collators (nodes authoring blocks) and 1 RPC node. We are using Paseo as an example, but this approach would work similarly for any Relaychain, whether it is a testnet (Westend, Paseo) or a mainnet (Polkadot, Kusama).
Preparations
Hardware
For this example network, you will need 3 machines. The specifications of these machines will depend on your intended usage. For a testnet, medium-sized virtual machines with 2 to 4 cores will suffice. However, for mainnet nodes, it is recommended to follow the "validator reference hardware" as detailed in the Polkadot Wiki.
Requirements:
- The machines should have a public IP and allow network access on their P2P ports (defaults 30333 and 30334) as well as the RPC port for the RPC node (9944 for ws or 443 for wss).
- The machine should have a big enough disk to host the relay-chain pruned database (>100 GB for Paseo)
- You should have obtained SSH access to these machines.
Parachain binary or docker image
Prepare the binary for use with Ansible
To deploy your network with the Ansible node role, you will need to have the node binary available from a public URL. If this binary is not already available for your parachain, you will need to build it yourself using the following command:
cargo build --release
Then publish the node binary present in target/releases somewhere and note down the public URL. One option to do this is to add it as a GitHub release asset.
In this guide, we will use the parachain-template-node that you can get from paritytech/polkadot-sdk-parachain-template's releases assets.
To deploy system parachain nodes, such as asset-hub and bridge-hub, you should use the polkadot-parachain binary published on https://github.com/paritytech/polkadot-sdk/releases/latest/.
Prepare the docker image for use with Kubernetes
To deploy your network with the node helm-chart, you will need to have a node docker image published to a public registry.
Generate parachain private keys
In this section, we will use the subkey utility.
Generate static node keys (aka network keys)
Node keys are used to identify nodes on the P2P network with a unique PeerID. To ensure this identifier persists across restarts, it is highly recommended to generate a static network key for all nodes. This practice is particularly important for bootnodes, which have publicly listed addresses that are used by other nodes to bootstrap their connections to the network.
To generate a static node key:
subkey generate-node-key --file node.key
# example output
12D3KooWExcVYu7Mvjd4kxPVLwN2ZPnZ5NyLZ5ft477wqzfP2q6E # PeerId (hash of public node key)
cat node.key
d5e120e30dfb0eac39b1a6727d81c548e9c6b39ca97e565438a33d87726781a6% # private node key, do not copy the percent sign
Generate keys for your collators (account+aura keys)
For parachains using the collatorSelection pallet to manage their collator set, you will need to generate a set of keys for each collator:
- Collator Account: a regular substrate account
- Aura keys (part of the collator “session keys”)
In this example, we will use the same seed for both. Use the following command generate a secret seed for each collator:
subkey generate
You can derive public keys and account IDs from an existing seed by using:
subkey inspect "<secret-seed>"
# example output
Secret Key URI `//Alice` is account:
  Network ID:        substrate
  Secret seed:       0xe5be9a5092b81bca64be81d212e7f2f9eba183bb7a90954f7b76361f6edb5c0a
  Public key (hex):  0xd43593c715fdd31c61141abd04a99fd6822c8558854ccde39a5684e7a56da27d
  Account ID:        0xd43593c715fdd31c61141abd04a99fd6822c8558854ccde39a5684e7a56da27d
  Public key (SS58): 5GrwvaEF5zXb26Fz9rcQpDWS57CtERHpNehXCPcNoHGKutQY
  SS58 Address:      5GrwvaEF5zXb26Fz9rcQpDWS57CtERHpNehXCPcNoHGKutQY
Reserve a ParaId on Paseo
Note: although it is possible to use specific UIs for registering your parachain, this guide only documents how to do it by submitting extrinsics directly through the Polkadot.js Console.
To get reserve a ParaId for your parachain on Paseo, navigate to the Polkadot.js Apps interface.
- Ensure you are connected to the Paseo network by selecting the appropriate RPC endpoint.
- Go to the "Developer" tab and select "Extrinsics".
- Choose
registrar.reservefrom the dropdown menu and execute it with your account. - Check the included extrinsic result in the block to find your reserved
para_idand note it down.
Create your Network Chainspec
When launching a new parachain network, customizing the chainspec (chain specification) is a crucial step.
Export your runtime file
First export your runtime file from your node binary (here --raw is used to export the output as binary not hex string):
parachain-template-node export-genesis-wasm --raw > runtime.wasm
If you want to select a specific built-in runtimle of your binary, add --chain chain-name to your command.
Prepare your genesis patch config
Save the following to genesis.patch.json (replace keys and configuration with your own):
{
  "balances": {
    "balances": [
      [
        "5GrwvaEF5zXb26Fz9rcQpDWS57CtERHpNehXCPcNoHGKutQY",
        1152921504606846976
      ],
      [
        "5FHneW46xGXgs5mUiveU4sbTyGBzmstUspZC92UhjJM694ty",
        1152921504606846976
      ]
    ]
  },
  "collatorSelection": {
    "candidacyBond": 16000000000,
    "invulnerables": [
      "5GrwvaEF5zXb26Fz9rcQpDWS57CtERHpNehXCPcNoHGKutQY",
      "5FHneW46xGXgs5mUiveU4sbTyGBzmstUspZC92UhjJM694ty"
    ]
  },
  "session": {
    "keys": [
      [
        "5GrwvaEF5zXb26Fz9rcQpDWS57CtERHpNehXCPcNoHGKutQY",
        "5GrwvaEF5zXb26Fz9rcQpDWS57CtERHpNehXCPcNoHGKutQY",
        {
          "aura": "5GrwvaEF5zXb26Fz9rcQpDWS57CtERHpNehXCPcNoHGKutQY"
        }
      ],
      [
        "5FHneW46xGXgs5mUiveU4sbTyGBzmstUspZC92UhjJM694ty",
        "5FHneW46xGXgs5mUiveU4sbTyGBzmstUspZC92UhjJM694ty",
        {
          "aura": "5FHneW46xGXgs5mUiveU4sbTyGBzmstUspZC92UhjJM694ty"
        }
      ]
    ]
  },
  "parachainInfo": {
    "parachainId": 4435
  },
  "polkadotXcm": {
    "safeXcmVersion": 4
  },
  "sudo": {
    "key": "5GrwvaEF5zXb26Fz9rcQpDWS57CtERHpNehXCPcNoHGKutQY"
  }
}
In this example:
balances: initial account balancescollatorSelection: configure the collatorSelection pallet properties, in this example we set Alice and Bob as initial invulnerable collators.session.keys: initial session keysparachainInfo.parachainId: parachain IDsudo.keys: initial sudo key account
Note that:
5GrwvaEF5zXb26Fz9rcQpDWS57CtERHpNehXCPcNoHGKutQY: Alice's account address5FHneW46xGXgs5mUiveU4sbTyGBzmstUspZC92UhjJM694ty: Bob's account address
Generate a customized plain Chainspec
With the chain-spec-builder utility, we can generate a chainspec file using only the runtime wasm file on which we will apply a patch describing the customized genesis config we want to apply
Download the chain-spec-builder binary from the latest polkadot-sdk releases. Then execute it, taking as input the runtime and genesis patch files:
chain-spec-builder -c chainspec.plain.json create -n "Test Parachain" -i test-parachain -t live -r runtime.wasm patch genesis.patch.json
To work properly as a parachain chainspec, add the following fields to your chainspec.plain.json:
{
  "protocolId": "template-local",
  "properties": {
    "ss58Format": 42,
    "tokenDecimals": 12,
    "tokenSymbol": "UNIT"
  },
  "para_id": 4435,
  "relay_chain": "paseo",
  ...
You also need to set your bootNodes addresses, any node which has a public IP or DNS can be a bootnode:
{
  "bootNodes": [
    # eg. IP bootnode
    "/ip4/<Node-Public-IP>/tcp/30333/p2p/<Node-ID>"
    # eg. DNS bootnode
    "/dns/<Node-Public-DNS>/tcp/30333/p2p/<Node-ID>",
    # (Optional) WSS Bootnodes (for light clients, requires a TLS cert, see https://wiki.polkadot.network/docs/maintain-bootnode)
    "/dns/<Node-Public-DNS>/tcp/443/wss/p2p/<Node-ID>",
  ...
}
Convert your Plain Chainspec to Raw
To initialize the genesis storage for your chain, you need convert your chainspec from plain to raw format. This process transforms the human-readable keys in the plain chainspec into actual storage keys and defines a unique genesis block.
A unique raw chainspec can be created from the plain chainspec with this command:
parachain-template-node build-spec --chain chainspec.plain.json --raw > chainspec.raw.json
⚠️ Only use the raw chainspec to launch your chain, not the plain chainspec.
(Optional) Dry-run your Parachain Network Locally
You should now have everything ready to launch your network locally to validate that everything is properly set up.
- Start your node (we use the
--tmpflag to prevent the node database files from being persisted to disk):
parachain-template-node --chain chainspec.raw.json --tmp
- Connect to it with Polkadot.js Apps on
ws://127.0.0.1:9944. - You can inspect the chain state in Polkadot.js Apps to verify that everything is in order for the launch.
Note: if you look at the node logs, it should be starting to sync the relay-chain (Paseo in our case). For this dry-run step, you don’t have to wait until it is fully synced. However, after deployment, a node needs to be fully synced in order to collate parachain blocks.
Deploy your nodes
You can use any method you choose to set up your nodes on your machines, we recommend either Ansible or Kubernetes.
Deploy your nodes with Ansible
Clone the project at paritytech/parachain-deployment-quickstart and follow instructions in the ansible folder.
Deploy your nodes with Kubernetes
Clone the project at paritytech/parachain-deployment-quickstart and follow instructions in the kubernetes folder.
Register and activate your Parachain on the Relaychain
Register parachain genesis code and state on relay-chain
You can export the genesis runtime (WASM code) and state files from your chainspec. Then, these files can be registered on the relaychain to initialize your parachain.
- Export the genesis state:
parachain-template-node export-genesis-state --chain chainspec.raw.json > genesis_state_head
- Export the genesis runtime:
parachain-template-node export-genesis-wasm --chain chainspec.raw.json > genesis_wasm_code
- Register your parachain genesis configuration on the relay-chain by executing the
registrar.registerextrinsic on Paseo:id: your parachain IDgenesisHead: select thegenesis_state_headfilevalidationCode: select thegenesis_wasm_codefile
Obtain on-demand coretime to produce your first block
- Execute extrinsic:
onDemandAssignmentProvider.placeOrderAllowDeathoronDemandAssignmentProvider.placeOrderKeepAlive:maxAmount:10000000000000(13 zeros, ie. 10 ROC)paraId: your parachain ID
After executing this, you should have successfully produced your first block !
INFO tokio-runtime-worker substrate: [Parachain] ✨ Imported #1 (0xa075…10d6)
Manage Coretime for your chain
To allow your parachain to produce blocks it needs to be allocated coretime (time allocated for utilizing a core) on the relaychain. What we mean by "core" is the ability of the relaychain (and its validators) to validate the new blocks of a parachain (received from the collators) so that they are “included” in Polkadot as finalized parachain blocks.
There are 2 types of coretime:
- On-demand coretime: lets users buy coretime by the block. Useful for parachains which don’t require continuous block production
- Bulk coretime: an allocation of uninterrupted 28 days (default region length) of coretime (possibly split in timeslices)
For more information, please refer to the Parachain Coretime Guide.
Reserve Bulk Coretime
- Go on Lastic Rococo Coretime Sales page and buy 1 core
- Go on Lastic Rococo Homepage, click on the “core nb X” that you own to show its dedicated page, then click "assign core".
Assign it to your ParaID and Finality:
Final
Note: any account with enough funds can buy and assign coretime for a parachain.
Renew Bulk Coretime
TODO
RPC Overview
An RPC node is a server that allows external applications to interact with the Polkadot chain. This interaction is facilitated through a set of standardized APIs which enable the execution of various operations and retrieval of blockchain data. Here are some key points about an RPC node in Polkadot:
Functions of an RPC Node: Querying Blockchain Data: RPC nodes can be used to fetch information from the blockchain, such as block details, transaction histories, account balances, and other state information. Submitting Transactions: External applications can use RPC nodes to broadcast transactions to the network. This includes sending tokens, executing smart contracts, or any other transaction type supported by Polkadot. Subscription to Events: RPC nodes can provide real-time updates on blockchain events, such as new blocks being added, changes in account balances, or other relevant blockchain events. Chain State and Metadata: RPC nodes allow applications to query the current state of the blockchain, as well as metadata about the runtime environment, including the version of the Polkadot runtime, the list of available RPC methods, and more.
Type of RPC Nodes
There are two common types of RPC nodes: archive nodes and pruned nodes, which differ in data storage and access.
-
Archive Nodes:
- Store the entire blockchain history, providing full state access for tasks requiring historical data, such as analytics and audits.
- Require substantial disk space.
- Important Flag:
--state-pruning archive --blocks-pruning archive(Ensures the node retains all historical data)
-
Pruned Nodes:
- Retain only recent data, offering limited historical access but using significantly less storage.
- Suitable for most day-to-day operations and network security.
- Important Flag:
--state-pruning 1000(Only keeps last 1000 of finalized blocks)
While archive nodes are essential for applications needing comprehensive historical data, pruned nodes are sufficient for wallets, validators, and other typical uses.
Important Flags for Running an RPC Node
-
--rpc-methods: Defines which RPC methods are available.- Example:
--rpc-methods=Unsafe - Options:
Auto,Safe,Unsafe
- Example:
-
--rpc-cors: Specifies the Cross-Origin Resource Sharing (CORS) settings.- Example:
--rpc-cors=all(Allow all origins) - Example:
--rpc-cors=http://localhost:3000(Allow specific origin)
- Example:
-
--rpc-port: Sets the port on which the RPC server listens.- Example:
--rpc-port=9933
- Example:
-
--rpc-external: Allows RPC connections from external sources.- Example:
--rpc-external
- Example:
-
--rpc-rate-limit: RPC rate limiting (calls/minute) for each connection..- Example:
--rpc-rate-limit=100
- Example:
-
--unsafe-rpc-external: Same as--rpc-external- Example:
--unsafe-rpc-external
- Example:
Securing the WS Port
Securing the WebSocket (WS) port is essential to prevent unauthorized access and potential security threats such as data breaches, man-in-the-middle attacks, and denial-of-service attacks. It is also necessary to access the node from the Polkadot-js UI.
Tools for Securing WebSocket Connections
A list of most common tools available that supports securing websocket:
-
NGINX: A popular web server and reverse proxy that can be configured to handle WebSocket connections securely.
- Documentation: NGINX WebSocket Support
-
HAProxy: A high-performance TCP/HTTP load balancer that can manage WebSocket connections securely.
- Documentation: HAProxy WebSocket Support
-
Traefik: A modern reverse proxy and load balancer that supports WebSocket connections and integrates well with various security features.
- Documentation: Traefik WebSocket Support
-
Cloudflare: Provides WebSocket support along with security features like DDoS protection and WAF.
- Documentation: Cloudflare WebSocket Support
-
AWS Application Load Balancer (ALB): Supports WebSocket connections and integrates with AWS WAF for additional security.
- Documentation: AWS ALB WebSocket Support
-
Caddy: A web server with automatic HTTPS that can also handle WebSocket connections securely.
- Documentation: Caddy WebSocket Support
How-to Guides
This section provides a deployment guide for an RPC node via Ansible and Kubernetes.
Guide: Deploying an RPC node
This guide demonstrates the deployment of an RPC node via Helm chart in Kubernetes.
Preparations
Parity maintains a helm GitHub repo @ https://github.com/paritytech/helm-charts - Inside this repo is the node chart which can be used for deploying your Substrate/Polkadot binary.
All variables are documented clearly in the README.md and there’s an example local-rococo which you can start working from.
Helm Deployment
Binary images are available at Dockerhub. Parity maintains both Polkadot and Polkadot-Parachain images from the polkadot-sdk repo.
When running an RPC node, a sidecar called ws-health-exporter is good to have to allow a readiness endpoint for Kubernetes.
helm repo add parity https://paritytech.github.io/helm-charts/
helm -n NAMESPACE upgrade --install RELEASE_NAME -f FILE_NAME.yml parity/node
Relaychain Helm Values
image:
  repository: parity/polkadot
  tag: v1.14.0
node:
  replicas: 1
  chain: westend
  role: full
  chainData:
    chainPath: westend2
    volumeSize: 600Gi
    storageClass: ssd-csi
    database: paritydb
    pruning: archive
  chainKeystore:
    mountInMemory:
      enabled: true
  flags:
    - "--rpc-max-connections 5000"
  perNodeServices:
    relayP2pService:
      enabled: true
      type: NodePort
    setPublicAddressToExternalIp:
      enabled: true
  persistGeneratedNodeKey: true
  enableOffchainIndexing: true
  serviceMonitor:
    enabled: true
  tracing:
    enabled: false
  resources:
    requests:
      cpu: 500m
      memory: 2Gi
    limits:
      cpu: 4
      memory: 7Gi

# RPC Endpoint
ingress:
  enabled: false
  annotations:
    kubernetes.io/ingress.class: TODO
    external-dns.alpha.kubernetes.io/target: TODO
    cert-manager.io/cluster-issuer: TODO
  host: parachain.example.com
  tls:
    - secretName: parachain.example.com
      hosts:
        - parachain.example.com

extraContainers:
- name: ws-health-exporter
  image: docker.io/paritytech/ws-health-exporter:0a2e6e9b-20230412
  env:
  - name: WSHE_NODE_RPC_URLS
    value: "ws://127.0.0.1:9944"
  - name: WSHE_NODE_MAX_UNSYNCHRONIZED_BLOCK_DRIFT
    value: "4"
  - name: WSHE_NODE_MIN_PEERS
    value: "2"
  resources:
    requests:
      cpu: 10m
      memory: 32M
    limits:
      cpu: 100m
      memory: 64M
  readinessProbe:
    httpGet:
      path: /health/readiness
      port: 8001
Parachains Helm Values
  image:
    repository: parity/polkadot-parachain
    tag: 1.14.0
  node:
    chain: bridge-hub-westend
    command: polkadot-parachain
    replicas: 1
    role: full
    chainData:
      database: paritydb
      pruning: archive
      volumeSize: 50Gi
      storageClass: ssd-csi
    chainKeystore:
      mountInMemory:
        enabled: true
    isParachain: true
    collatorRelayChain:
      chain: westend
      chainData:
        database: paritydb
        pruning: 1000
        storageClass: ssd-csi
        volumeSize: 150Gi
        chainPath: westend2
      chainKeystore:
        mountInMemory:
          enabled: true
    flags:
      - "--rpc-max-connections 1000"
    perNodeServices:
      relayP2pService:
        enabled: true
        type: NodePort
      paraP2pService:
        enabled: true
        type: NodePort
      setPublicAddressToExternalIp:
        enabled: true
    resources:
      requests:
        cpu: 1
        memory: 2Gi
      limits:
        memory: 4Gi

# RPC Endpoint
ingress:
  enabled: false
  annotations:
    kubernetes.io/ingress.class: TODO
    external-dns.alpha.kubernetes.io/target: TODO
    cert-manager.io/cluster-issuer: TODO
  host: parachain.example.com
  tls:
    - secretName: parachain.example.com
      hosts:
        - parachain.example.com
Best Practices
- The advantage of running in Kubernetes is the number of replicas can easily be added behind an ingress.
- A backup is ideally used due to easily scale up new RPC nodes
- Enabling serviceMonitor to enable monitoring of the RPC nodes
Introduction
Collators are members of the network that maintain the parachains they take part in. Collators produce the state transition proof for relay chain validators but also author the blocks for the parachain and pass them to relay chain. There are some requirements that need to be considered prior to becoming a collator candidate including machine, bonding, account, and community requirements. For more info regarding collators, reference collator section on Polkadot wiki page.
This doc demonstrates how to add new collators to an already running parachain.
Hardware Requirements
Make sure your instance has at least the minimum recommended harware requirements:
- CPU: 2 Cores - Intel Xeon E-2386/2388 or Ryzen 9 5950x/5900x
- Memory: 8GB
- Disk: Depending on the chain size - 200GB SSD/nvme
Launch the Collator
1- Generate an Account 2- Run the Collator 3- Bind The Account With Collator's Session Keys 4- Bond Funds
1- Create an Account
This account is used to hold funds and submit the extrinsics to bond and register your collator as candidate.
> subkey generate
Secret phrase:       crane material doll wife text jaguar cross donor crane caught soft permit
  Network ID:        substrate
  Secret seed:       0x79613c5ccb1c8aa9c21e1ddb2fbf65c8e979649cd52cfe041391c9f9d07ec3e9
  Public key (hex):  0x4a503b20b3ada9ff3bf985271b5756e650a83ae47e44a7552dc2415ce8060a52
  Account ID:        0x4a503b20b3ada9ff3bf985271b5756e650a83ae47e44a7552dc2415ce8060a52
  Public key (SS58): 5Dk9EY7iUbjLX6fTDnbFZVGdnN7v2NgQtxj4Y7YjjZXgpCjE
  SS58 Address:      5Dk9EY7iUbjLX6fTDnbFZVGdnN7v2NgQtxj4Y7YjjZXgpCjE
Store the secret phrase in a secure place. This account will be used on PolkadotJS app to bind you collator session keys to it.
2- Run the Collator
Now that we have node keys ready, it's time to the collator with the provided chainspec to sync our node with network. Depending on the chain size (both relay and para chains), this will take some time until the node is completely synced with the network:
./target/release/parachain-node-template --collator \
--name collator1 \
--base-path /tmp/parachain/collator1 \
--chain parachain-chainspec-raw.json \
--collator \
--rpc-port 10001 \
--ws-port 10002 \
--listen-addr /ip4/0.0.0.0/tcp/10003/ws \
-- \
--chain /{PATH_TO_RELAYCHAIN_CHAINSPEC} \
--port 10004 \
--ws-port 10005
Before jumping to the next steps, you have to wait until your node is fully synchronized:
journalctl -f -u shibuya-node -n100
3- Bind Your Account with Session Keys
Session keys are a set of cryptographic keys used by collators/validators to securely participate in the consensus mechanism and perform various roles within the network. These keys are essential for ensuring the integrity and security of the blockchain.
As a collator, you need to link your session keys to your collator account (The account which is created in step 1 and hold the funds). Once linked, the keys are used to identify your collator node. Your collator address will receive the permit to build blocks, but the session keys pass this permit to your node.
Author Session Keys
In order to obtain the session keys, SSH to your node and run the below curl command:
curl -H "Content-Type: application/json" -d '{"id":1, "jsonrpc":"2.0", "method": "author_rotateKeys", "params":[]}' http://localhost:9944
The result will look like this (you just need to copy the key):
{"jsonrpc":"2.0","result":"0x600e6cea49bdeaab301e9e03215c0bcebab3cafa608fe3b8fb6b07a820386048","id":1}
You can access to the private key generated in this process by reaching the file generated under chains/<chain-name>/keystore.
Set Session Keys
Go to the Polkadot.js portal and connect to respective network (e.g. Rococo-AssetHub).
Go to Developper > Extrinsic and select your collator account and extrinsic type: session / setKeys
In the Keys section paste your session key obtained from the curl command and in the proof section enter 0x. Finally submit the call.
Note: The proof depends on the session key. For instance if your session key was started with 00x the proof would be 00x.
4- Bond Funds
Dependig on the parachain, you need a minimum amount of funds to be able to start authoring the blocks. Go to the Polkadot.js portal: Developer > Extrinsics Select your collator account and extrinsic type: CollatorSelection / registerAsCandidate and finally submit the transaction.
Congratulations! If you have followed all of these steps, and been selected to be a part of the collator set, you are now running a collator! Once your collator is active, you will see your name inside Network tab every time you produce a block:
Kubernetes
If you wish to run the collator on kubernetes environment, there's already a node helm-chart developed by parity that supports collators.
Add Node Helm Chart Repo
helm repo add parity https://paritytech.github.io/helm-charts/
helm -n NAMESPACE upgrade --install RELEASE_NAME -f FILE_NAME.yml parity/node
Install the node helm chart
Here's an example values file that will be needed to properly deploy the parachain:
node:
  image:
    repository: parity/polkadot-parachain
    tag: 1.14.0
  node:
    chain: asset-hub-polkadot
    command: polkadot-parachain
    replicas: 2
    role: collator
    chainData:
      database: paritydb
      volumeSize: 100Gi
      storageClass: ssd-csi
      pruning: 1000
    chainKeystore:
      mountInMemory:
        enabled: true
    isParachain: true
    collatorRelayChain:
      chain: polkadot
      chainData:
        database: paritydb
        pruning: 256
        storageClass: ssd-csi
        volumeSize: 200Gi
        chainSnapshot:
          enabled: true
          method: http-filelist
          url: https://snapshots.polkadot.io/polkadot-paritydb-prune
        chainPath: polkadot
      chainKeystore:
        mountInMemory:
          enabled: true
    perNodeServices:
      relayP2pService:
        enabled: true
      paraP2pService:
        enabled: true
        port: 30333
      apiService:
        enabled: true
        type: ClusterIP
      setPublicAddressToExternalIp:
        enabled: true
Parachain Production Readiness Checklist
Before launching your parachain network, verify the readiness of your network infrastructure by reviewing the following five key points.
- 1. Launch your parachain on a testnet before launching on mainnet
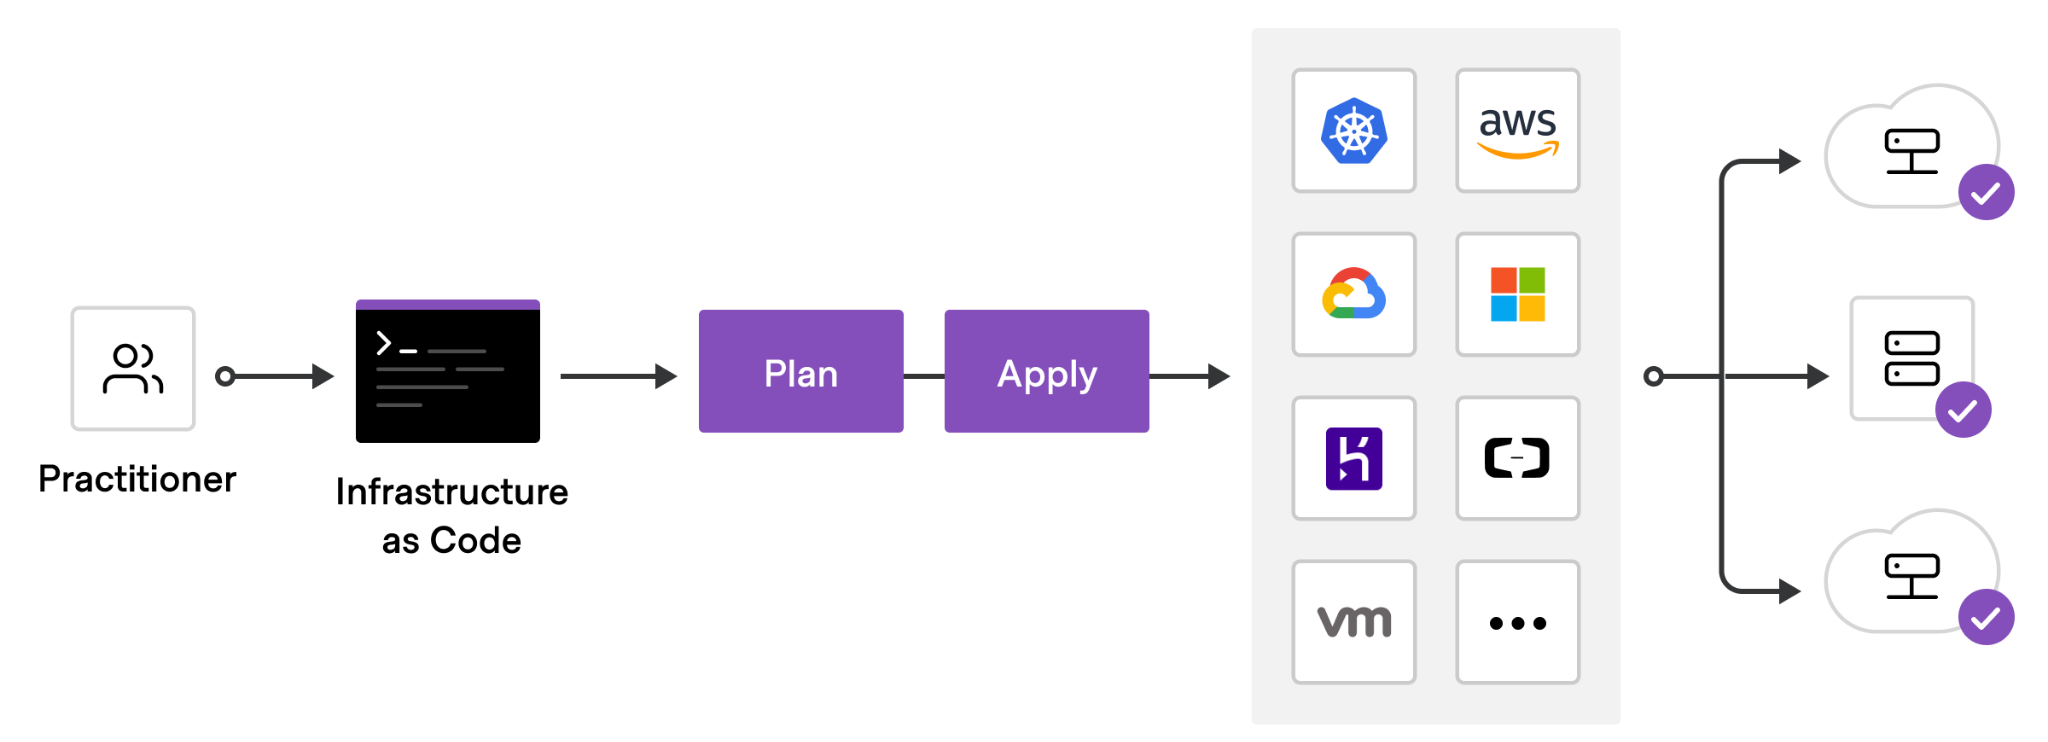
- 2. Use Infrastructure as Code
- 3. Ensure redundancy for your network nodes
- 4. Check that your nodes are properly configured to fulfil their roles
- 5. Validate that your nodes are fully synced
- 6. Set up monitoring and alerting
1. Launch your parachain on a testnet before launching on mainnet
The best way to validate your deployment is to deploy a testnet for your parachain. The recommended relay-chain testnet for builders is now Paseo where you can benefit from a stable and mainnet-like experience before onboarding to Polkadot.
2. Set up your nodes using Infrastructure as Code
Using Infrastructure as Code for your blockchain nodes helps with the following:
- Consistency and Reproducibility: Reduces manual configurations and allows configuration reuse across testnet and mainnet.
- Automation and Efficiency: Although it takes upfront work to set up, you will speed up further deployments by reducing the number of manual steps.
- Disaster Recovery: In the event of a disaster, you will be able to quickly restore your infrastructure.
3. Ensure redundancy for your network nodes
For a reliable network, it is recommended to have at least:
- 2 Bootnodes
- 2 Collators
- 2 RPC nodes behind a load balancer
This will help ensure the smooth operation of the network, allowing one node to restart or upgrade while the other still performs its function. After launch, it is a good idea to increase the size of the network further and decentralize node operations to multiple individuals and organizations.
4. Check that your nodes are properly configured to fulfil their roles
Chainspec checks
Your chainspec must:
- Have all the required properties such as
para_idandrelay_chain - Be converted to raw format
- Have the desired chain state in its genesis block viewable in a local parachain dry-run
- Reference your bootnodes addresses so your nodes will connect to the correct network on startup
Bootnode checks
Your bootnodes must have a fixed network ID and fixed IP or DNS in their addresses, e.g., /dns/polkadot-bootnode-0.polkadot.io/tcp/30333/p2p/12D3KooWSz8r2WyCdsfWHgPyvD8GKQdJ1UAiRmrcrs8sQB3fe2KU. This can be achieved with these flags, e.g:
--node-key-file <key-file> --listen-addr=/ip4/0.0.0.0/tcp/30333 --listen-addr /ip6/::/tcp/30333 --public-addr=/ip4/PUBLIC_IP/tcp/30333.
⚠️ Your bootnodes should always keep the same addresses across restarts.
Collator checks
- Each of your collators must have an aura key in their keystore, as explained in the [collator guide](TODO link to collator guide)
- The aura keys also need to be set on-chain, either:
- in the genesis state directly in the chainspec file
- by [submitting a setKeys extrinsic with your collator account](TODO link to collator guide)
RPC checks
Your RPC nodes should have those flags enabled:
--rpc-externalor--unsafe-rpc-external(does the same but doesn't output a warn log)--rpc-methods Safe--rpc-cors *--pruning=archive, you generally want to have your RPC nodes to be archives to access historical blocks.
You can also add RPC protections flags, e.g.:
--rpc-max-connections 1000: Allow a maximum of 1000 simultaneous open connection--rpc-rate-limit=10: Limit to 10 calls per minute--rpc-rate-limit-whitelisted-ips 10.0.0.0/8 1.2.3.4/32: Disable RPC rate limiting for certain ip addresses--rpc-rate-limit-trust-proxy-headers: Trust proxy headers for determining the IP for rate limiting
5. Validate that your nodes are fully synced
Your parachain nodes should be fully synced with the latest blocks of both your parachain and the relay-chain it is connected to.
6. Set up monitoring and alerting
At a minimum, it is recommended to collect your nodes logs and be notified whenever an error or panic logs happens.
It is highly recommended to set up metrics based monitoring and alerting, including:
- General system-level metrics, e.g. by using the prometheus node exporter to watch over disk, cpu, memory, oom kills, etc.
- Polkadot-sdk native metrics
Tips:
- For troubleshooting testnets collators you can set
--log parachain=debug. Other useful debug targets areruntime=debug,sync=debug,author=debug,xcm=debug, etc. - You should avoid setting trace logging on all your nodes; if you do, set it on a limited number of nodes where it is useful and remove it when not needed anymore.
Explanations
General Approach to Infrastructure
It is highly recommended that projects deploying networks have an infrastructure as code mindset. The infrastructure components in deployments should be written in code and put in a version control system.
This ensures that:
- Your Infrastructure is in a known state
- Version control is available to see changes and enforce reviews etc...
- Rolling back is made very easy
- There are no manual actions required to redeploy
General Approach to Security
One of the main desired properties of a blockchain is security, so having a very ‘secure by default’ approach to your infrastructure should always be in the forefront of your mind when deploying new networks.
On the infrastructure side, having strict rules and blocking any non-required communication is just a starting point. Other things that should be considered are things like log monitoring, bastion hosts being required for access, 2FA for ssh etc…
On the chain operations side, there are two very useful concepts to increase your security.
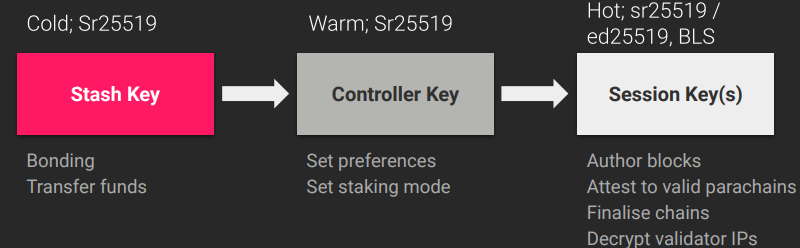
First is using cold / warm / hot keys, so that the compromise of say a session key would not lead to any funds being stolen. Also using multisig accounts on offline devices can greatly help security and also give an on-chain audit trail of all actions, allows for alerting for any onchain actions etc...
Proxy accounts also let you limit the permission that an account or multisig account has on a particular target account (e.g. only staking functions can be executed by the staking controller multisig account and require 3 of 5 people to approve).
Deployments
This section describes the various types of deployments and options used for each.
Blockchain Node Roles
A non exhaustive list of some common roles assumed by nodes:
| Role | Description |
|---|---|
| Validator | Secures the Relay Chain by staking DOT, validating proofs from collators on parachains and voting on consensus along with other validators. |
| Collator | Maintains a parachain by collecting parachain transactions and producing state transition proofs for the validators. |
| Bootnode | A node with a static address and p2p public key, used to bootstrap a node onto the network’s distributed hash table and find peers. |
| RPC Node | Expose an RPC interface over http or websocket for the relay chain or parachain and allow users to read the blockchain state and submit transactions (extrinsics). There are often multiple RPC nodes behind a load balancer. |
Additionally, we also usually distinguish types of nodes:
| Type | Description |
|---|---|
| Full Node | A node which is syncing the relay chain or parachain to the current best block. It can make use of database pruning to reduce its disk usage. |
| Archive Node | A full node which has a complete database starting all the way from the genesis block. |
| Light Node | Also called light client, can connect to a chain network but does not require to have full copy of the entire blockchain |
Simplified Diagram of the Parachain Network architecture
The diagram below illustrate how different nodes play different roles in the network by having different configuration.

- Bootnodes expose their P2P port behind an easy to find IP or DNS address.
- RPC nodes expose their RPC endpoint publicly.
- Collators sign blocks and propose them for validation to the Relaychain validators
- We can adjust the database pruning (archive or pruned) depending on the node role.
Downsides of deploying nodes without clear role separation
Although, it is possible for a single node to assume multiple roles (collator, RPC, bootnode), robust network deployments are composed of multiple nodes of each types to ensure reliability.
For example, if a collator node also serves as an RPC node, receiving increased user traffic might overload the node and bring down block production. To prevent this from happening, it is possible to set up several dedicated RPC nodes behind a load balancer. Similarly, setting up additional collators in your network will allows downtime of fraction of the collator set without slowing down block production.
Deployment Targets
A non-exhaustive list of some common deployment targets:
| Type | Description |
|---|---|
| Physical Server | Usually a rack mounted server sitting in a data center. |
| Virtual Machine | A virtual machine hosted by one of many cloud providers or self-hosted onsite. |
| Kubernetes | A container orchestration engine to host your blockchain instances. This option is only recommended if you already have prior experience with Kubernetes, especially in production environments. |
| Local Container | An instance running on a local container engine (e.g. containerd, docker, Podman). |
Special Options Per Host Type
| Type | Function |
|---|---|
| Validator | Should at least be running with the --validator flag to enable block validation. Also keys should have been injected or the RPC author_rotateKeys called. |
| Collator | Should at least be running with the --collator flag to enable parachain collation. |
| Bootnode | A node with a static key file so the p2p public address is always the same. Store this private key in a file and use the option: --node-key-file /path/to/file |
| RPC Node | Use these options to allow 5000 public RPC/WS connections: --unsafe-ws-external --rpc-methods Safe --rpc-cors ‘*’ --ws-max-connections 5000 |
| Archive Node | Use -–pruning=archive to not prune any block history |
| Full Node | N/A |
Parachain Specifics
When running a parachain then you will need two sets of arguments, one for the relay chain and one for the parachain. Used in the format:
./statemine $PARACHAIN_OPTIONS -- $RELAYCHAIN_OPTIONS
A real life example of this while executing as a statemine collator would be:
./statemine --chain statemine --in-peers 25 --out-peers 25 --db-cache 512 --pruning=1000 --unsafe-pruning -- --chain kusama -db-cache 512 --pruning=1000 --wasm-execution Compiled
Server Deployments
Systemd
Overview
Systemd is a common way to manage services on Linux hosts. It can ensure the process is enabled and running, allows you to set a policy for restarts and also set the user running the host, limit the memory usage etc...
It can also use an environment variable file which can help abstract the variables into its own file per server.
Simple Example
A simple example running a local dev chain as Alice, assuming the username is called polkadot would look like:
[Unit]
Description=Polkadot Validator

[Service]
User=polkadot
ExecStart=/home/polkadot/polkadot  --dev --alice
Restart=always
RestartSec=90

[Install]
WantedBy=multi-user.target
This file should be placed in /etc/systemd/system/polkadot.service and then enabled with systemctl enable polkadot then systemctl start polkadot to start the service.
Using Environment Variable Files
If we want to remove some options from the systemd file itself (e.g. --dev --alice) and put them in an environment variable file then the systemd service would now look like:
[Unit]
Description=Polkadot Validator

[Service]
User=polkadot
EnvironmentFile=/etc/default/polkadot
ExecStart=/home/polkadot/polkadot  $START_OPTIONS
Restart=always
RestartSec=90

[Install]
WantedBy=multi-user.target
Then you would need to create a file in /etc/default/polkadot which looks like:
START_OPTIONS="--dev --alice"
You can do this with multiple variables to abstract the configuration from the systemd file running on your hosts.
Logging
Local Logging
By default, output from your systemd service will go to local syslog. This will mean it ends up in a place like /var/log/syslog or /var/log/messages
You can also view these using the journalctl command. To tail the current output of the polkadot process run:
journalctl -u polkadot -f
It is also possible to remove old logs (say older than two days ago) using a command:
journalctl -u polkadot --vacuum-time=2d
Or to retain only the past 1G of data run:
journalctl --vacuum-size=1G
Remote Logging
In a setup with many hosts you will want to aggregate the logs at a central point, some common options include Loki or Elasticsearch.
Loki
To log to a remote Loki instance you need to install the promtail package. An example configuration file to send logs to a remote host:
# promtail server config
server:
  http_listen_port: 9080
  grpc_listen_port: 0
  log_level: info
positions:
  filename: /var/lib/promtail/positions.yaml

# loki servers
clients:
  - url: http://myloki.mycompany.com/loki/api/v1/push
    backoff_config:
      min_period: 1m
      max_period: 1h
      max_retries: 10000
scrape_configs:
  - job_name: journald
    journal:
      max_age: 1m
      path: /var/log/journal
      labels:
        job: journald
    pipeline_stages:
      - match:
          selector: '{job="journald"}'
          stages:
            - multiline:
                firstline: '^\d{4}-\d{2}-\d{2} \d{2}:\d{2}:\d{2}\.\d{3}'
                max_lines: 2500
            - regex:
                expression: '(?P<date>\d{4}-\d{2}-\d{2} \d{2}:\d{2}:\d{2}\.\d{3})\s+(?P<level>(TRACE|DEBUG|INFO|WARN|ERROR))\s+(?P<worker>([^\s]+))\s+(?P<target>[\w-]+):?:?(?P<subtarget>[\w-]+)?:[\s]?(?P<chaintype>\[[\w-]+\]+)?[\s]?(?P<message>.+)'
            - labels:
                level:
                target:
                subtarget:
Elasticsearch
To log to a remote Elasticsearch cluster you need to install the logstash package. An example configuration would look like:
<<<<<<< HEAD
input {
  journald {
    path      => "/var/log/journal"
    seekto => "tail"
    thisboot => true
    filter    => {
      "_SYSTEMD_UNIT" => "polkadot.service"
    }
    type => "systemd"
  }
=======

```yaml
input {
     journald {
       path      => "/var/log/journal"
       seekto => "tail"
       thisboot => true
       filter    => {
           "_SYSTEMD_UNIT" => "polkadot.service"
       }
       type => "systemd"
     }
>>>>>>> main
}


filter {
  date {
    match => ["timestamp", "YYYY-mm-dd HH:MM:ss.SSS"]
    target => "@timestamp"
  }
  mutate {
    rename => [ "MESSAGE", "message" ]
    remove_field => [ "cursor", "PRIORITY", "SYSLOG_FACILITY", "SYSLOG_IDENTIFIER", "_BOOT_ID", "_CAP_EFFECTIVE", "_CMDLINE", "_COMM", "_EXE", "_GID", "_HOSTNAME", "_MACHINE_ID", "_PID", "_SELINUX_CONTEXT", "_STREAM_ID", "_SYSTEMD_CGROUP", "_SYSTEMD_INVOCATION_ID", "_SYSTEMD_SLICE", "_SYSTEMD_UNIT", "_TRANSPORT", "_UID" ]
  }
  if ([message] =~ ".*TRACE .*") { drop{ } }
  grok {
    match => { "message" => "%{NOTSPACE:thread} %{LOGLEVEL:log-level} %{NOTSPACE:namespace} %{GREEDYDATA:message}" }
  }
}

output {
  elasticsearch {
    hosts => ["https://myelasticsearch.mycompany.com:9243"]
    user => "username"
    password => "password"
    index => "logstash-polkadot-%{+YYYY.MM.dd}"
  }
}
Logging Options
Logging output from any substrate based changes has many log levels and targets. All targets are set to info logging by default. You can adjust individual log levels using the --log (-l short) option, for example -l afg=trace,sync=debug or globally with -ldebug.
Levels:
- error
- warn
- info
- debug
- trace
Targets:
- afg
- aura
- babe
- beefy
- db
- gossip
- header
- peerset
- pow
- rpc
- runtime
- runtime::contracts
- sc_offchain
- slots
- state-db
- state_tracing
- sub-libp2p
- sync
- telemetry
- tracing
- trie
- txpool
Automation
Cloud Provisioning
There are multiple options to provision cloud resources, which can either be provider specific and some tools are more cloud-agnostic.
Popular Cloud Provider Specific Deployment Tooling
These vendor specific deployment tools are easy to use, have great examples and support. However, when using multiple providers with custom scripting formats, making a basic to your infrastructure can require changes to multiple sections of code, for each provider to do the same thing (e.g. open a port on a host).
A more general solution where a change can be specified once and be used with multiple providers is using Terraform. Which currently has more than 2000 providers supported.
Terraform
Terraform is a very commonly used tool for creating all sorts of cloud resources. It supports many different providers along with having excellent modules for the main three providers (AWS, Azure, GCP). Many projects rely on this for their infrastructure deployments.
It uses HashiCorp’s HashiCorp Configuration Language, which makes it very easy to abstract configuration, avoid the reuse of code and enables you to plug modules together easily (e.g. RPC nodes along with a frontend load balancer).
The code is also easy to read and should be in version control. Multiple environments can be defined, so you can ensure you are using the same code on dev / test / production.
Two ways to preconfigure your host after deployment using terraform directly is to either:
- Use a pre-packaged image with all of your software (e.g. packer or similar tooling)
- Use a cloud-init script to execute a certain script to preconfigure your base image
Some examples of using terraform with multiple providers can be found in the W3F’s polkadot-validator-setup GitHub repo.
Click here for a list of terraform providers.
Host Maintenance
Once your hosts are deployed you will need to configure the hosts and install the required software, configuration files etc… As mentioned this can be done in a few ways using terraform itself, however another very flexible way of configuring hosts is using Ansible.
| Component | Description |
|---|---|
| Playbook | Playbooks are the language by which Ansible orchestrates, configures, administers, or deploys systems |
| Role | Roles are units of organization in Ansible. Assigning a role to a group of hosts (or a set of groups, or host patterns, and so on) implies that they should implement a specific behavior |
When deploying our blockchain nodes, we will need an inventory which contains a list of our hosts and the groups they are in (e.g. validator, collator, rpc) and maybe some secrets which can be encrypted inline within the inventory using Ansible vault. We will then call a playbook which links hosts/groups in the inventory with roles to execute on each host.
Some examples of using Ansible can be found in the Paritytech's Ansible Galaxy GitHub repo. Specifically the node role.
Kubernetes
As previously mentioned, Kubernetes deployments are only recommended for people with good prior operating experience of Kubernetes.
Helm Chart
Overview
Parity maintains a helm GitHub repo @ https://github.com/paritytech/helm-charts - Inside this repo is the node chart which should be used for deploying your Substrate/Polkadot binary.
All variables are documented clearly in the README.md and there’s an example local-rococo which you can start working from.
Example Rococo Local Chain
This is a simple example of deploying a rococo-local test chain in Kubernetes. Two validators and two full nodes will be deployed via the helm chart. Once both validators are running you will see block production. A custom node key is used on the Alice validator which all other hosts use as a bootnode.
First install the helm repo
helm repo add parity https://paritytech.github.io/helm-charts/
Deploy Validator Alice
Alice will be deployed in a stateful set and use an example custom node key, along with deploying a service to be used as a bootnode:
helm install rococo-alice parity/node --set node.role="validator" --set node.customNodeKey="91cb59d86820419075b08e3043cd802ba3506388d8b161d2d4acd203af5194c1" --set node.chain=rococo-local --set node.perNodeServices.relayP2pService.enabled=true --set node.perNodeServices.relayP2pService.port=30333 --set node.flags="--alice --rpc-external --ws-external --rpc-cors all --rpc-methods=unsafe"
Deploy Validator Bob
helm install rococo-bob parity/node --set node.role="validator" --set node.chain=rococo-local --set node.flags="--bob --bootnodes '/dns4/rococo-alice-node-0-relay-chain-p2p/tcp/30333/p2p/12D3KooWMeR4iQLRBNq87ViDf9W7f6cc9ydAPJgmq48rAH116WoC'"
Deploy Two Full Nodes
helm install rococo-pool parity/node --set node.chain=rococo-local --set node.replicas=2 --set node.flags="--bootnodes '/dns4/rococo-alice-node-0-relay-chain-p2p/tcp/30333/p2p/12D3KooWMeR4iQLRBNq87ViDf9W7f6cc9ydAPJgmq48rAH116WoC'"
Once these steps are complete you will have a working rococo-local test chain with two validators and two full nodes.
GitOps Tooling
Below are some useful GitOps tool for managing helm releases. Here is a list of tool from simplest to more advanced:
Important Chart Options
| Option | Description |
|---|---|
| node.chain | Network to connect to |
| node.command | Binary to use |
| node.flags | Flags to use with binary in container |
| node.customChainspecUrl | Custom Chainspec URL |
Polkadot Key Injection
Chart Settings:
Ensure allowUnsafeRpcMethods: true is set in the helm chart values.
Example Key Injection Values:
Add example keys, in this case //Testing/babe (sr25519) and //Testing//gran (ed25519) on chain polkadot-dev:
  keys:
    - type: "gran"
      scheme: "ed25519"
      seed: "//Testing//gran"
    - type: "babe"
      scheme: "sr25519"
      seed: "//Testing"
      extraDerivation: //babe
Get public keys:
 $ polkadot key inspect //Testing//babe --network polkadot
 Secret Key URI `//Testing//babe` is account:
  Network ID:        polkadot
 Secret seed:       0x35993b5ca38b5909a26dbc15b736dede3bdf233ce63380f6ae62cb0ca096483b
  Public key (hex):  0x28c63dd7bb87238daf363a539da87d3c67d66a199e24f7751432e4f2363e8147
  Account ID:        0x28c63dd7bb87238daf363a539da87d3c67d66a199e24f7751432e4f2363e8147
  Public key (SS58): 1vToiVGY8q2kuG5XaN4JXrydgmkvoNMPpbwb9fPU8uQuRM5
  SS58 Address:      1vToiVGY8q2kuG5XaN4JXrydgmkvoNMPpbwb9fPU8uQuRM5
  $ polkadot key inspect //Testing//gran --network polkadot --scheme ed25519
  Secret Key URI `//Testing//gran` is account:
   Network ID:        polkadot
  Secret seed:       0xbfc22ae1e901dbd25057747b315481cf8a470261ea81892a9aa31be1391a0dcb
   Public key (hex):  0x7819b7ddc959b749a5da604c3a2d7d3e0097760be603d596f19d116d6207ad38
   Account ID:        0x7819b7ddc959b749a5da604c3a2d7d3e0097760be603d596f19d116d6207ad38
   Public key (SS58): 13iUPPkgWezjEpxFyfCKczLkrsBtJfwMWYhjDRwvtCKp1v3s
   SS58 Address:      13iUPPkgWezjEpxFyfCKczLkrsBtJfwMWYhjDRwvtCKp1v3s
- Babe key: 0x28c63dd7bb87238daf363a539da87d3c67d66a199e24f7751432e4f2363e8147
- Grandpa Key: 0x7819b7ddc959b749a5da604c3a2d7d3e0097760be603d596f19d116d6207ad38
Verify keys exist
 $ yarn run:api rpc.author.hasKey 0x28c63dd7bb87238daf363a539da87d3c67d66a199e24f7751432e4f2363e8147 babe
   {
      "hasKey": true
   }
   $ yarn run:api rpc.author.hasKey 0x7819b7ddc959b749a5da604c3a2d7d3e0097760be603d596f19d116d6207ad38 gran
   {
     "hasKey": true
   }
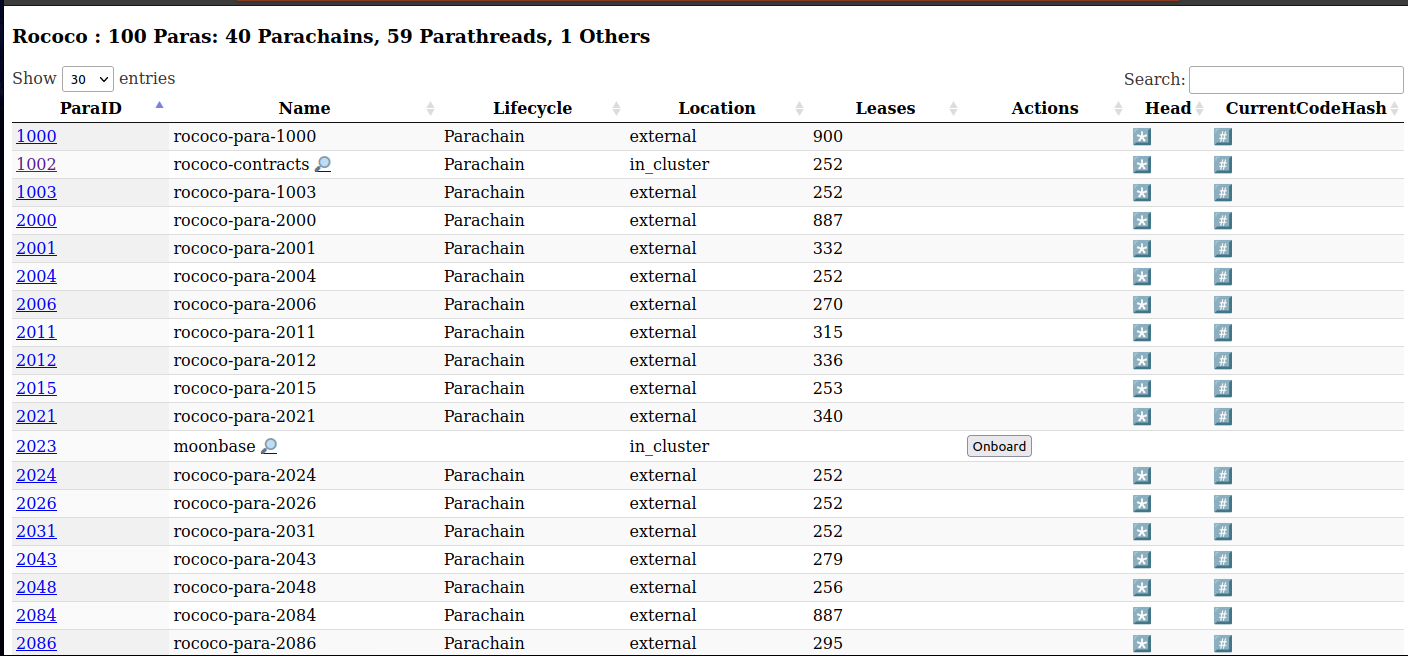
Testnet Manager
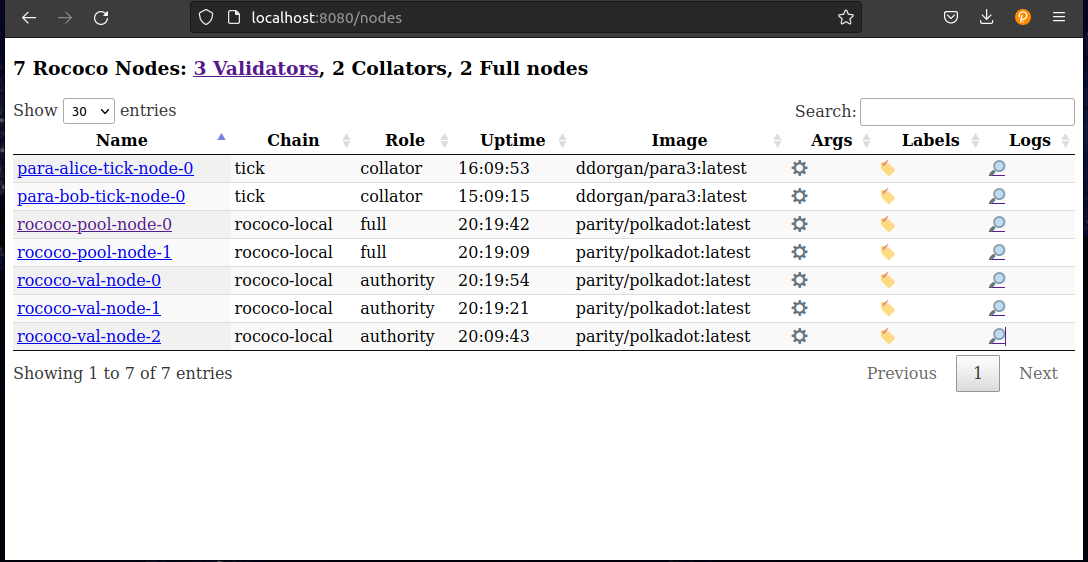
The Testnet manager (helm chart) lets you dynamically control test networks via a simple UI or API. It gives you a single pane of glass to list, inspect and interact with the nodes (full nodes, validators and parachain collators) running in a given Kubernetes namespace.
Rococo Example View
List Parachains
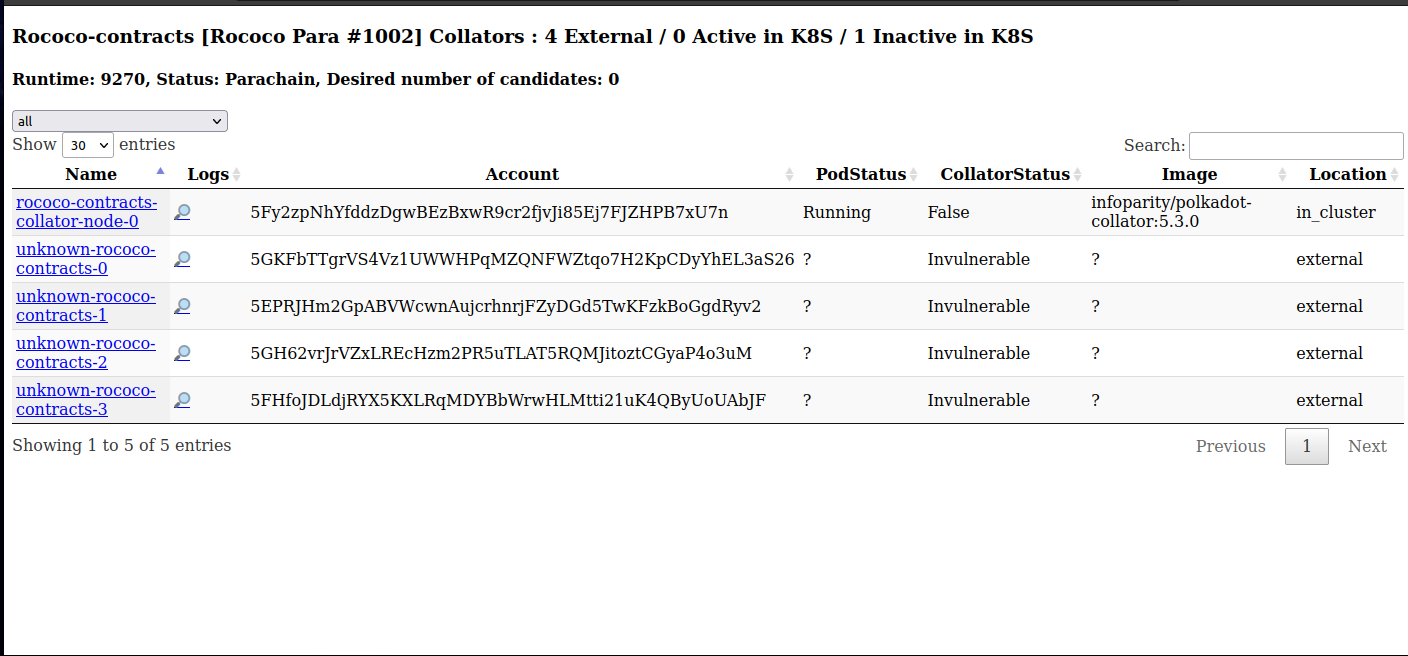
List Parachain Collators
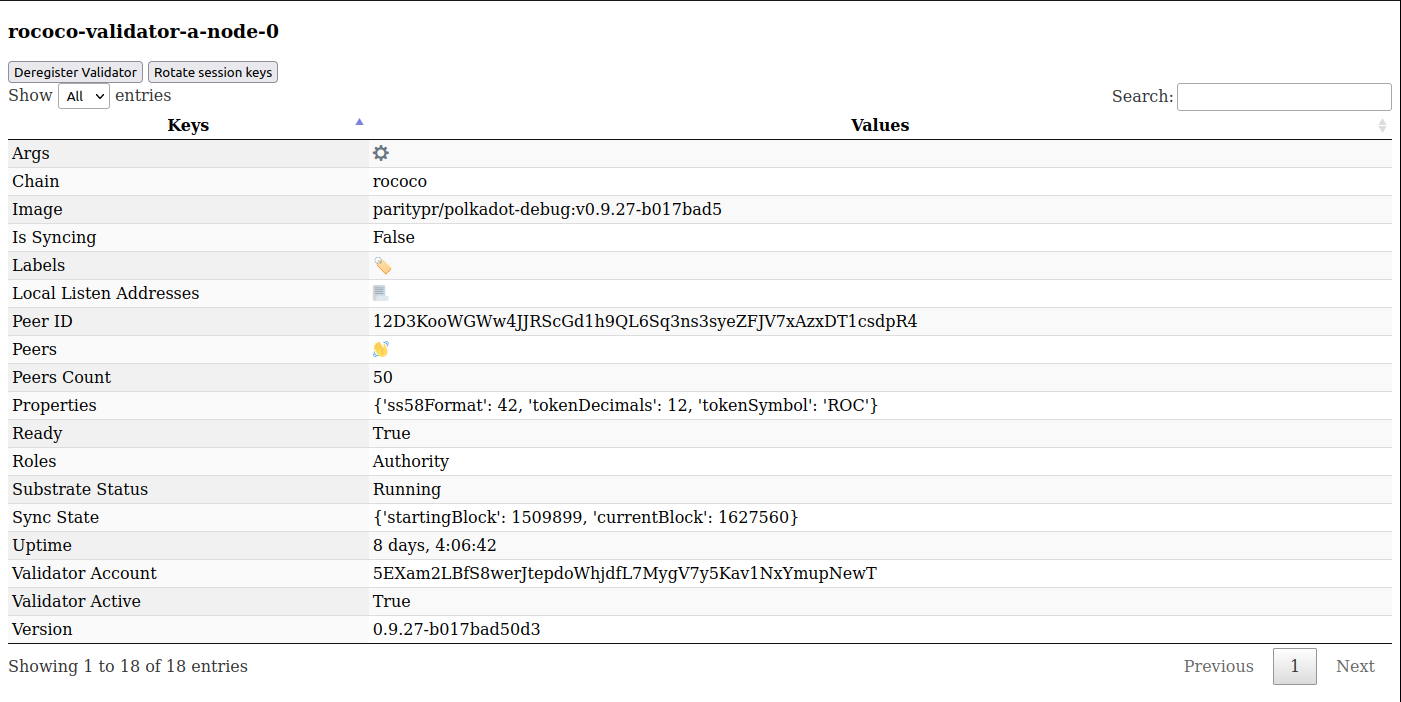
Inspect Validator Node
Usage
Requirements
The testnet manager requires the chain Sudo seed phrase to perform management functions. Also, some chain specific variables should be defined in a configmap, this can be added to the values.yaml:
configmap:
  WS_ENDPOINT: "ws://rococo-alice-node-0.rococo:9944"
  NODE_HTTP_PATTERN: "http://NODE_NAME.rococo:9933"
  NODE_WS_PATTERN: "ws://NODE_NAME.rococo:9944"
  HEALTHY_MIN_PEER_COUNT: "1"
  LOG_LEVEL: DEBUG

secret:
  SUDO_SEED: "0xe5be9a5092b81bca64be81d212e7f2f9eba183bb7a90954f7b76361f6edb5c0a" # Alice
  VALIDATORS_ROOT_SEED: "test test test test test test test test test test test test"
Then install the testnet manager and port forward a connection using the output of helm install ...:
helm repo add parity https://paritytech.github.io/helm-charts/
helm repo update
helm install testnet-mgr parity/testnet-manager --values values.yaml
Frontend GUI
In the nodes section you can view all running nodes, their roles, chain, uptime, CLI arguments, and you can also view logs.
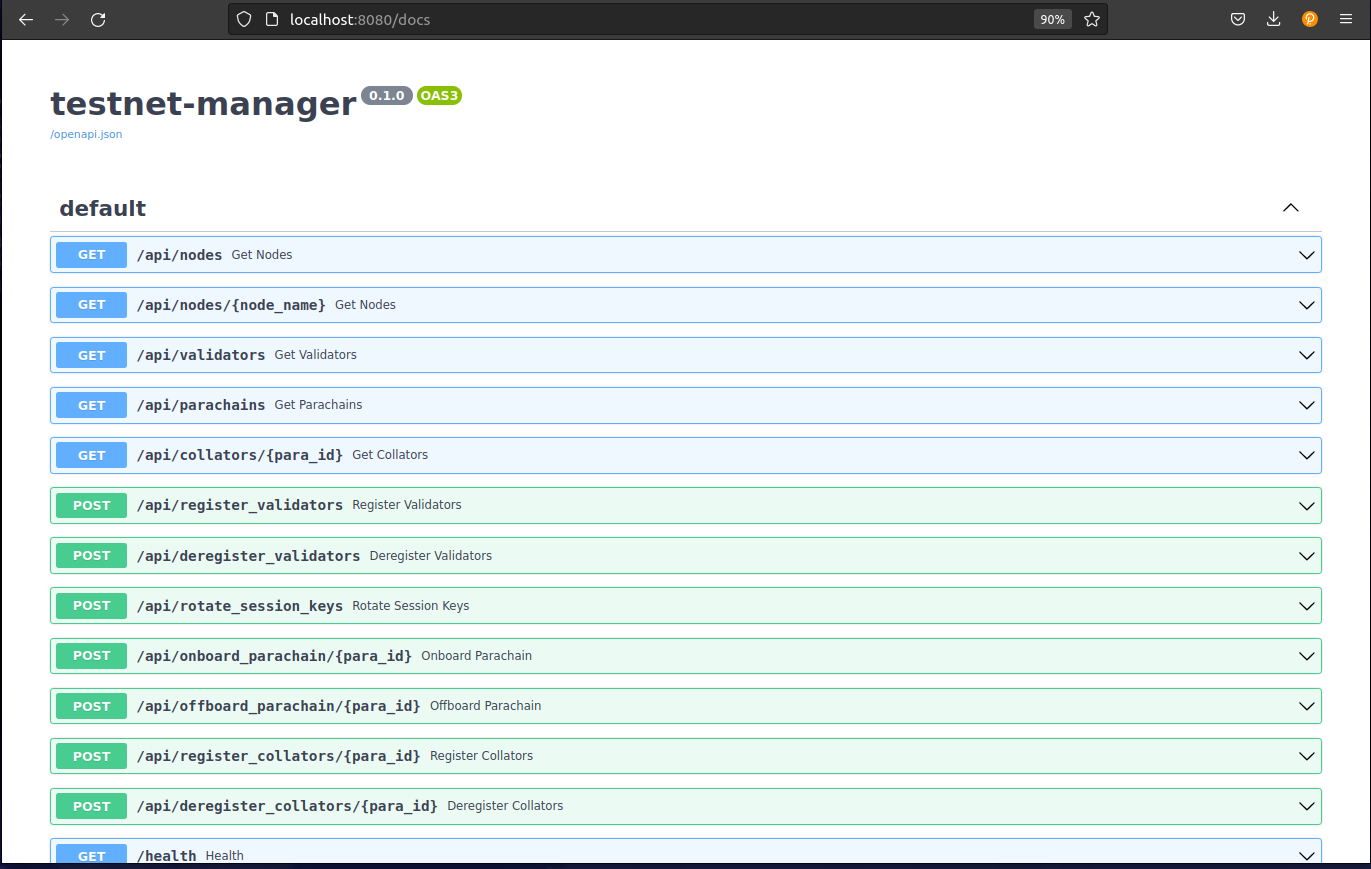
Interact with API via Frontend
It's possible to view the API calls and execute them via the GUI. The main functions are:
- Viewing nodes, validators, collators and parachains
- Registering / deregistering validators and collators
- Onboarding / off-boarding parachains
- Rotating session keys
Examples
Register a new validator in the StatefulSet called rococo-val-pool:
curl -X 'POST' \
  'http://localhost:8080/api/register_validators?statefulset=rococo-val-pool' \
  -H 'accept: application/json' \
  -d ''
Onboard Parachain id 1000:
curl -X 'POST' \
'http://localhost:8080/api/onboard_parachain/1000' \
-H 'accept: application/json' \
-d ''
How does it work ?
The testnet-manager is deployed in the same Kubernetes namespaces as nodes deployed with the node helm-chart. As node pods deployed with the chart are tagged with the appropriate labels (e.g. chain name, para ID), the manager is able to query the Kubernetes API and list the running nodes for each network (relay-chain, parachains).
By combining this list of nodes with the on-chain state retrieved from RPC endpoints (e.g. list of active validators accounts), the manager can automate node key setup (by interacting directly with each node RPC endpoint) and registration (by submitting sudo extrinsics). Behind the scenes, it uses a derivation formula for generating deterministic Validator/Collator accounts addresses: "${VALIDATORS_ROOT_SEED}//${node-name}".
Monitoring Overview
Monitoring can be categorized into two main areas:
On-chain
This involves tracking events that occur on the blockchain. Examples include:
- Transactions by specific addresses
- Changes in the validator set
On-chain monitoring typically involves checking blockchain data via RPC nodes to assess values, delays, and the timing of events. It is recommended to run your own RPC servers to avoid potential issues with public RPC nodes. There are useful tools such as Polkabot and Polkadot-Basic-Notification to help with on-chain monitoring.
On-Host
On-host monitoring involves tracking the individual node itself. Examples include:
- Current block height
- Number of peer-to-peer (P2P) connections
- Finality lag
To monitor individual node, polkadot-sdk binary exposes metrics in a Prometheus type format at http://host:9615/metrics. By default, this endpoint is only exposed on the local network interface, but you can expose it on all interfaces using the --prometheus-external flag.
As the metrics provided by these endpoints don't include hosts metrics (e.g. CPU, memory, bandwidth usage), it is recommended to complement it with other tools such as Prometheus node exporter which needs to be installed on the same host.
Monitoring Stack
Polkadot tools
- polkadot-introspector: The Polkadot Introspector is a collection of tools for monitoring and introspection of Polkadot or other substrate-based blockchains.
- polkadot-telemetry: The telemetry server is used for real time information from nodes, showing information about their name, location, current best & finalized blocks, and others. It gives a useful dashboard to view the state of nodes. An example of live running Telemetry site is https://telemetry.polkadot.io/
Non-Polkadot specific tools
The recommended Polkadot monitoring stack consists of the following tools:
- Prometheus: A systems and service monitoring system based on a timeseries database.
- Grafana: allows you to query, visualize, and understand your metrics.
- Alertmanager: Creates and routes alerts to the tool of your choice (Email / SMS / Telegram / PagerDuty / Slack / Matrix) based on alert rules and metrics
- Loki - A highly scalable log aggregation system that allows you to view and search logs from all your infrastructure in one place.
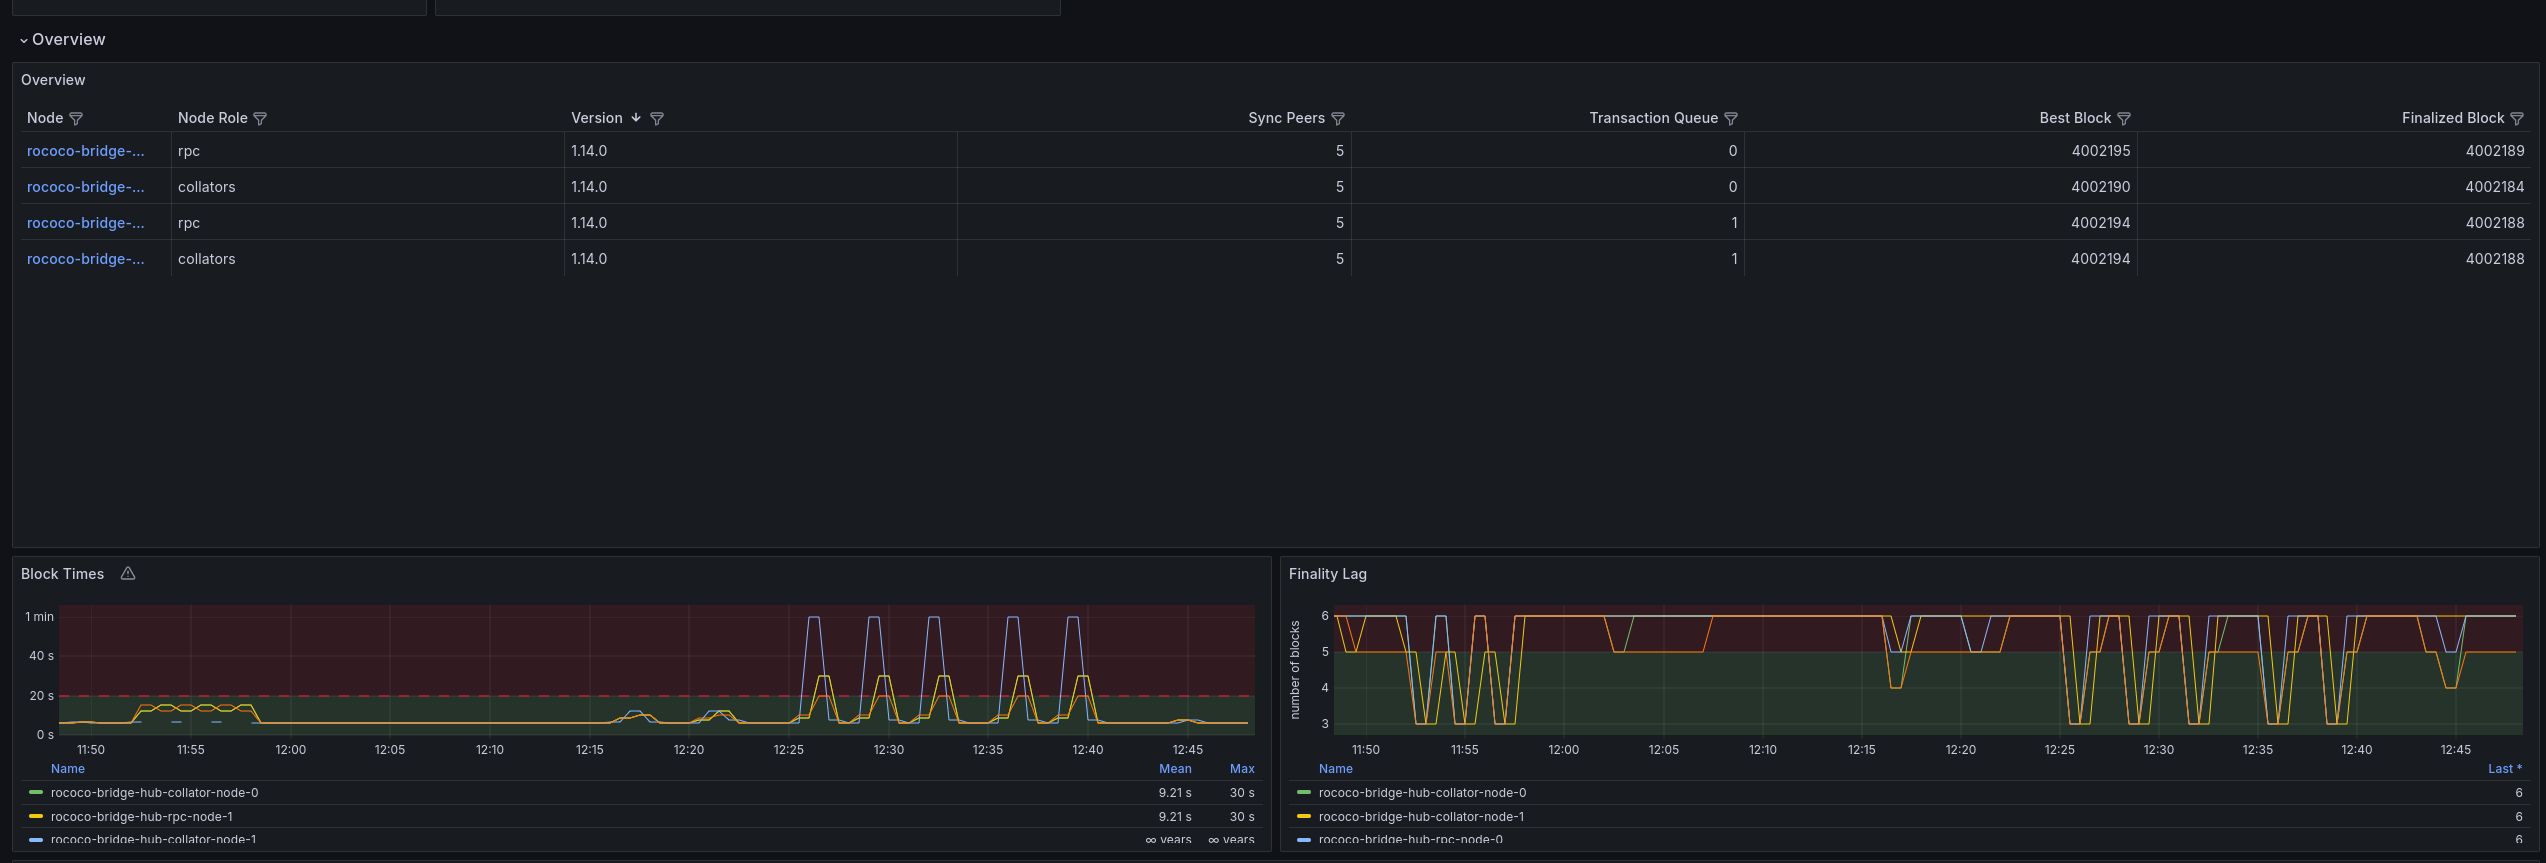
For available set of Polkadot dashboards, alerts and rules are listed in polkadot-monitoring-mixin repository.
An example of the metric dashboard from polkadot-monitoring-mixin:
Infrastructure Tools
Prometheus, Loki, Alertmanager, and Grafana are powerful tools commonly used for monitoring and visualizing metrics and logs in a distributed system. Here, we focus on integrating these tools to effectively monitor Polkadot metrics across relay chains and parachains.
Metrics
Prometheus is an open source solution that can be used to collect metrics from applications. It collects metrics from configured targets endpoints at given intervals, evaluates rule expressions, displays the results, and can trigger alerts when specified conditions are observed.
Prometheus Configuration
Targets are a list of endpoints you want to scrape. The two main exporters we care about are for 1) polkadot/substrate and 2) the node-exporter. An example of scraping these on the IP address 10.100.0.0 would be:
scrape_configs:
  - job_name: polkadot
    static_configs:
      - targets:
          - 10.100.0.0:9080    # promtail
          - 10.100.0.0:9100    # node exporter
          - 10.100.0.0:9615    # relaychain metrics
          - 10.100.0.0:9625    # parachain metrics
Logs
Loki is an open source solution that can be used to aggregate logs from applications, allowing the operator to see errors, patterns and be able to search through the logs from all hosts very easily. An agent such as Promtail or Grafana Alloy is used to push logs to the Loki server.
Example promtail.yaml configuration to collect the logs and create a Promtail metrics that aggregates each log level:
# promtail server config
server:
  http_listen_port: 9080
  grpc_listen_port: 0
  log_level: info
positions:
  filename: /var/lib/promtail/positions.yaml

# loki servers
clients:
  - url: http://loki.example.com/loki/api/v1/push
    backoff_config:
      min_period: 1m
      max_period: 1h
      max_retries: 10000

scrape_configs:
  - job_name: journald
    journal:
      max_age: 1m
      path: /var/log/journal
      labels:
        job: journald
    pipeline_stages:
      - match:
          selector: '{job="journald"}'
          stages:
            - multiline:
                firstline: '^\d{4}-\d{2}-\d{2} \d{2}:\d{2}:\d{2}\.\d{3}'
                max_lines: 2500
            - regex:
                expression: '(?P<date>\d{4}-\d{2}-\d{2} \d{2}:\d{2}:\d{2}\.\d{3})\s+(?P<level>(TRACE|DEBUG|INFO|WARN|ERROR))\s+(?P<worker>([^\s]+))\s+(?P<target>[\w-]+):?:?(?P<subtarget>[\w-]+)?:[\s]?(?P<chaintype>\[[\w-]+\]+)?[\s]?(?P<message>.+)'
            - labels:
                level:
                target:
                subtarget:
            - metrics:
                log_lines_total:
                  type: Counter
                  Description: "Total Number of Chain Logs"
                  prefix: "promtail_chain_"
                  max_idle_duration: 24h
                  config:
                    match_all: true
                    action: inc
      - match:
          selector: '{job="journald", level="ERROR"}'
          stages:
            - multiline:
                firstline: '^\d{4}-\d{2}-\d{2} \d{2}:\d{2}:\d{2}\.\d{3}'
                max_lines: 2500
            - metrics:
                log_lines_total:
                  type: Counter
                  Description: "Total Number of Chain Error Logs"
                  prefix: "promtail_chain_error_"
                  max_idle_duration: 24h
                  config:
                    match_all: true
                    action: inc
      - match:
          selector: '{job="journald", level=~".+"} |~ "(?i)(panic)"'
          stages:
            - multiline:
                firstline: '^\d{4}-\d{2}-\d{2} \d{2}:\d{2}:\d{2}\.\d{3}'
                max_lines: 2500
            - metrics:
                log_lines_total:
                  type: Counter
                  Description: "Total Number of Chain Panic Logs"
                  prefix: "promtail_chain_panic_"
                  max_idle_duration: 24h
                  config:
                    match_all: true
                    action: inc
    relabel_configs:
      - source_labels: ["__journal__systemd_unit"]
        target_label: "unit"
      - source_labels: ["unit"]
        regex: "(.*.scope|user.*.service)"
        action: drop
      - source_labels: ["__journal__hostname"]
        target_label: "host"
      - action: replace
        source_labels:
          - __journal__cmdline
          - __journal__hostname
        separator: ";"
        regex: ".*--chain.*;(.*)"
        target_label: "node"
        replacement: $1
The above example also configures the following custom metrics derived from logs promtail_chain_log_lines_total, promtail_chain_error_log_lines_total and promtail_chain_panic_log_lines_total to be exposed on the promtail metrics endpoint http://host:9080.
Alerts
Alertmanager handles alerts sent by Prometheus client, and responsible for deduplicating, grouping and routing to the correct receiver such as email, PagerDuty, and other mechanisms via webhook receiver.
A simple alert for block production being slow would look like:
- alert: BlockProductionSlow
  annotations:
    message: 'Best block on instance {{ $labels.instance }} increases by
less than 1 per minute for more than 5 minutes.'
  expr: increase(substrate_block_height{status="best"}[1m]) < 1
  for: 5m
  labels:
    severity: warning
Visualization
Grafana is where you can define dashboards to show the time series information that Prometheus is collecting. You just need to ensure you add a datasource:
datasources:
  - name: "Prometheus"
    type: prometheus
    access: proxy
    editable: false
    orgId: 1
    url: "http://prometheus.monitoring.svc.cluster.local"
    version: 1
    jsonData:
      timeInterval: 30s
  - name: Loki
    type: loki
    access: proxy
    orgId: 1
    url: http://loki:3100
    basicAuth: false
    version: 1
    editable: true
Polkadot-mixin
Polkadot-monitoring-mixin is a set of Polkadot monitoring dashboards, alerts and rules collected based on our experience operating Polkadot Relay Chain and Parachain nodes. You can find it in this repo.
Docker Compose
You can install the following components Docker Compose if you are evaluating, or developing monitoring stack for Polkadot. The configuration files associated with these installation instructions run the monitoring stack as a single binary.
version: "3.8"

networks:
  polkadot:

services:
  prometheus:
    container_name: prometheus
    image: prom/prometheus:v2.53.0
    command:
      - '--config.file=/etc/prometheus/prometheus.yml'
    ports:
      - 9090:9090
    restart: unless-stopped
    configs:
      - source: prometheus_config
        target: /etc/prometheus/prometheus.yml
    networks:
      - polkadot

  loki:
    container_name: loki
    image: grafana/loki:3.1.0
    ports:
      - "3100:3100"
    command: -config.file=/etc/loki/local-config.yaml
    networks:
      - polkadot

  promtail:
    container_name: promtail
    image: grafana/promtail:3.1.0
    command: -config.file=/etc/promtail/config.yml
    user: root # Required to read container logs
    ports:
      - 9080:9080
    volumes:
      - /var/lib/docker/containers:/var/lib/docker/containers
      - /var/run/docker.sock:/var/run/docker.sock
    configs:
      - source: promtail_config
        target: /etc/promtail/config.yml
    networks:
      - polkadot

  grafana:
    container_name: grafana
    image: grafana/grafana:latest
    environment:
      - GF_PATHS_PROVISIONING=/etc/grafana/provisioning
      - GF_AUTH_ANONYMOUS_ENABLED=true
      - GF_AUTH_ANONYMOUS_ORG_ROLE=Admin
    entrypoint:
      - sh
      - -euc
      - |
        mkdir -p /etc/grafana/provisioning/datasources
        cat <<EOF > /etc/grafana/provisioning/datasources/ds.yaml
        apiVersion: 1
        datasources:
        - name: Loki
          type: loki
          access: proxy
          orgId: 1
          url: http://loki:3100
          basicAuth: false
          version: 1
          editable: true
        - name: Prometheus
          type: prometheus
          access: proxy
          orgId: 1
          url: http://prometheus:9090
          basicAuth: false
          isDefault: true
          version: 1
          editable: true
        EOF
        /run.sh
    ports:
      - "3000:3000"
    networks:
      - polkadot

  polkadot_collator:
    container_name: polkadot_collator
    image: parity/polkadot-parachain:1.14.0
    command: >
      --tmp --prometheus-external --prometheus-port 9625 -- --tmp --prometheus-external --prometheus-port 9615
    ports:
      - "9615:9615"
      - "9625:9625"
    networks:
      - polkadot

configs:
  prometheus_config:
    content: |
      global:
        scrape_interval: 15s # By default, scrape targets every 15 seconds.
        evaluation_interval: 15s # Evaluate rules every 15 seconds.

      scrape_configs:
        - job_name: polkadot
          static_configs:
            - targets:
                - polkadot_collator:9615    # relaychain metrics
                - polkadot_collator:9625    # parachain metrics
  promtail_config:
    content: |
      server:
        http_listen_port: 9080

      positions:
        filename: /tmp/positions.yaml

      clients:
        - url: http://loki:3100/loki/api/v1/push

      scrape_configs:
      - job_name: containers
        docker_sd_configs:
          - host: unix:///var/run/docker.sock
            refresh_interval: 5s
            filters:
              - name: name
                values: [polkadot_collator]
        relabel_configs:
          - source_labels: ['__meta_docker_container_name']
            regex: '/(.*)'
            target_label: 'container'
On-Host Configuration
The polkadot-sdk binary supports Prometheus metrics, which are exposed at http://host:9615/metrics. By default, this endpoint is only available on the local network interface. To expose it on all interfaces, you can use the --prometheus-external flag. However, when running a polkadot-parachain binary, managing the metrics becomes more complex due to two ports being used for different purposes.
Running the Polkadot Binary (Relay Chain)
To run the Polkadot binary with Prometheus metrics exposed, use the following command:
./polkadot --tmp --prometheus-external
Running the Polkadot-Parachain Binary (Parachain)
For the Polkadot-Parachain binary, use the following command to expose Prometheus metrics on a specified port:
./polkadot-parachain --tmp --prometheus-external --prometheus-port 9625 -- --tmp --prometheus-port 9615
As you can see above, running a polkadot-parachain binary can expose two different Prometheus port to ensure separation of metrics between relay chain and parachain.
Common Substrate metrics
Here is a non-exhaustive lists of useful metrics exposed on the nodes metrics endpoint:
substrate_block_height: the best and finalized block number for this node. This should be increasing when your node is producing or syncing blocks from the network.substrate_sub_libp2p_peers_count: the number of node peerssubstrate_sub_txpool_validations_finished: transactions in the node transaction queue, there should be some but not too high counts which would mean that the transaction are not propagated to other nodes.substrate_sub_libp2p_incoming_connections_total: this must be constantly increasing especially on validators and collators as those active nodes need to be able to receive incoming connections from other peers. This can be a sign that the node is incorrectly configured to allow p2p access (--listen-addr/--public-addr).
Differences in Metric Labels
There are key differences in the labels of metrics exposed by the relay chain and parachain binaries:
Relay Chain Metrics at Port 9615
# TYPE polkadot_memory_allocated gauge
polkadot_memory_allocated{chain="rococo_local_testnet"} 225670544

# HELP polkadot_memory_resident Bytes allocated by the node, and held in RAM
# TYPE polkadot_memory_resident gauge
polkadot_memory_resident{chain="rococo_local_testnet"} 679718912

# HELP polkadot_node_is_active_validator Tracks if the validator is in the active set. Updates at session boundary.
# TYPE polkadot_node_is_active_validator gauge
polkadot_node_is_active_validator{chain="rococo_local_testnet"} 0
Parachain Metrics at Port 9625
# HELP substrate_block_height Block height info of the chain
# TYPE substrate_block_height gauge
substrate_block_height{status="best",chain="local_testnet"} 0
substrate_block_height{status="finalized",chain="local_testnet"} 0
substrate_block_height{status="sync_target",chain="local_testnet"} 0
Best Practices
To avoid confusion caused by running metrics on different ports, it is recommended to maintain uniformity by using the same Prometheus port (default is 9615) for all relay chain metrics. The chain label in the metrics helps determine which metric belongs to which chain, ensuring clarity and organization.
By following this guide, you can effectively expose and manage Prometheus metrics for both the Polkadot relay chain and parachain binaries.
Keys And Accounts
This page will describe some basic information on keys and accounts. For a more general and detailed explanation see learn accounts on the polkadot wiki page.
Encryption Schemes
| Name | Type |
|---|---|
| ed25519 | The vanilla ed25519 implementation using Schnorr signatures. |
| sr25519 | The Schnorrkel/Ristretto sr25519 variant using Schnorr signatures. (default) |
| ecdsa | ECDSA signatures on secp256k1 |
Session Key Types
| Name | Type |
|---|---|
| grandpa | ed25519 |
| authority_discovery | sr25519 |
| aura | sr25519 |
| babe | sr25519 |
| para_validator | sr25519 |
| para_assignment | sr25519 |
| beefy | ecdsa |
Key Generation and Inspection
You can use polkadot-parachain keys or the subkey command to generate and inspect keys.
Two important subcommands are:
generateCreate a new random account and print the private key data or save to a file.inspectView the account data for an account by passing a secret phrase or seed.
Some important options are:
--networkspecify the network the keys will be used on, default is substrate.--schemethe scheme for the keys, default is sr25519.
Generate
Create a Random Account Key
$ polkadot-parachain key generate
Secret phrase:       test test test test test test test test test test test junk
  Network ID:        substrate
  Secret seed:       0x4ca479f5e0dc0ee04ebcbadb64c220267dad42b8cfa4da1f0874787523b4709c
  Public key (hex):  0xd000ac5048ae858aca2e6aa43e00661562a47026fe88ff83992430204a159752
  Account ID:        0xd000ac5048ae858aca2e6aa43e00661562a47026fe88ff83992430204a159752
  Public key (SS58): 5GmS1wtCfR4tK5SSgnZbVT4kYw5W8NmxmijcsxCQE6oLW6A8
  SS58 Address:      5GmS1wtCfR4tK5SSgnZbVT4kYw5W8NmxmijcsxCQE6oLW6A8
You can save it to a file using
Inspection
Inspect Created Key
$ polkadot-parachain key inspect "test test test test test test test test test test test junk"
Secret phrase:       test test test test test test test test test test test junk
  Network ID:        substrate
  Secret seed:       0x4ca479f5e0dc0ee04ebcbadb64c220267dad42b8cfa4da1f0874787523b4709c
  Public key (hex):  0xd000ac5048ae858aca2e6aa43e00661562a47026fe88ff83992430204a159752
  Account ID:        0xd000ac5048ae858aca2e6aa43e00661562a47026fe88ff83992430204a159752
  Public key (SS58): 5GmS1wtCfR4tK5SSgnZbVT4kYw5W8NmxmijcsxCQE6oLW6A8
  SS58 Address:      5GmS1wtCfR4tK5SSgnZbVT4kYw5W8NmxmijcsxCQE6oLW6A8
Inspect Created Key With Hard Derivation //Stash//0
$ polkadot-parachain key inspect " test test test test test test test test test test test junk//Stash//0"
Secret Key URI ` test test test test test test test test test test test junk//Stash//0` is account:
  Network ID:        substrate
  Secret seed:       0x88f170a1438f83de6c2b845282ebb577dfcaee4c896655e64777ba220b3ad33d
  Public key (hex):  0xa2a73aaf576ed83371c92642a80706bf4b007c40f689d649aa7b075833d7242c
  Account ID:        0xa2a73aaf576ed83371c92642a80706bf4b007c40f689d649aa7b075833d7242c
  Public key (SS58): 5FjyHtMBm7kArqgSX52DAQvZeJ2Tq5sQBwFfSmZ3NWMHs4Be
  SS58 Address:      5FjyHtMBm7kArqgSX52DAQvZeJ2Tq5sQBwFfSmZ3NWMHs4Be
Managing a node session keys
In Polkadot, Session Keys refer to the hot keys set on a node to perform various network operations, such as collating or validating blocks.
Create new session keys on a node via the author_rotateKeys RPC method
On the remote machine hosting the node, you can create new session keys with the following commmand:
curl -H "Content-Type: application/json" -d '{"id":1, "jsonrpc":"2.0", "method": "author_rotateKeys", "params":[]}' http://localhost:9944
The response output will then show the hex-encoded concatenation of the session public keys. This is intended to be submitted on-chain using the session.setKeys extrinsics.
Insert a specific key onto a node keystore via the author_insertKey RPC method
To inject a key via RPC, use the following command:
curl -H "Content-Type: application/json" \ --data '{ "jsonrpc":"2.0", "method":"author_insertKey", "params":["'"${KEY_TYPE}"'", "'"${KEY_SEED}"'"],"id":1 }' http://localhost:9933
Set:
KEY_TYPEto a session key type (eg.babe,grandpa)KEY_SEEDto a secret seed or private key
Insert a specific key onto a node keystore using the node binary
To inject a key via the node binary, use the following command:
polkadot-parachain key insert -d <my_chain_folder> --key-type ${KEY_TYPE} --scheme ${KEY_SCHEME} --suri ${KEY_FILE}
KEY_TYPE: a session key type (eg.babe,grandpa)KEY_SCHEME: an encryption scheme (eg.sr25519,ed25519,ecdsa)KEY_FILE: a plain text file which contains the seed or private key
Custom Chain - Chainspecs
This section will explain what is required to build a custom chain spec for your own network. For more in depth explanations on how chainspecs works internally, refer to the Polkadot-sdk Chainspec docs
Create Chain Spec with the node binary
You can create a plain chainspec for your network with:
node build-spec –chain chain-name --disable-default-bootnode > custom-chainspec.json
Important Fields:
| Field | Purpose |
|---|---|
| Name | Name of the network |
| id | Id of network, also used for the filesystem path |
| bootNodes | List of multiaddr’s of bootnodes for the network |
| protocolId | A unique identifier for the protocol |
| para_id | (Parachains only) numerical ID of the parachain slot |
| relay_chain | (Parachains only) Id of the relaychain to connect to |
| genesis.runtimeGenesis | (Plain chainspec only) Configuration of the genesis runtime |
| genesis.raw | (Raw chainspec only) Serialization of the raw of the genesis storage |
Once the values have been updated this chainspec should be converted in raw format using the command:
node build-spec –chain custom-chainspec.json –raw > custom-chainspec-raw.json
Using the chain-spec-builder
The chain-spec builder is a utility that can create a chainspec from a runtime wasm. The tool's linux binary can be downloaded from the polkadot-sdk release page or built from sources in polkadot-sdk/substrate/bin/utils/chain-spec-builder.
Create a genesis.json file from presets
Runtimes can have config presets which are examples of valid genesis configuration files that can be edited for customizing chainspecs.
List the available presets of a runtime
$ chain-spec-builder list-presets --runtime-wasm-path rococo_runtime-v1015000.compact.compressed.wasm
{
  "presets": [
    "local_testnet",
    "development",
    "staging_testnet",
    "wococo_local_testnet",
    "versi_local_testnet"
  ]
}
Unfortunately, not all existing runtimes have embedded presets, if those are not available, you should ask your chain developers to move their genesis config presets from the node binary to the runtime (see eg. polkadot-sdk#4749).
Export a config preset from a runtime file
$ chain-spec-builder display-preset --runtime-wasm-path rococo_runtime-v1015000.compact.compressed.wasm --preset-name staging_testnet > rococo-genesis.json
rococo-genesis.json
{
  "babe": {
    "epochConfig": {
      "allowed_slots": "PrimaryAndSecondaryVRFSlots",
      "c": [
        1,
        4
      ]
    }
  },
  "balances": {
    "balances": [
      [
        "5DwBmEFPXRESyEam5SsQF1zbWSCn2kCjyLW51hJHXe9vW4xs",
        1000000000000000000
      ],
      [
        "5EHZkbp22djdbuMFH9qt1DVzSCvqi3zWpj6DAYfANa828oei",
        100000000000000
      ],
      [
        "5DvH8oEjQPYhzCoQVo7WDU91qmQfLZvxe9wJcrojmJKebCmG",
        100000000000000
      ],
      [
        "5FPMzsezo1PRxYbVpJMWK7HNbR2kUxidsAAxH4BosHa4wd6S",
        100000000000000
      ],
      [
        "5DMNx7RoX6d7JQ38NEM7DWRcW2THu92LBYZEWvBRhJeqcWgR",
        100000000000000
      ],
      [
        "5C8AL1Zb4bVazgT3EgDxFgcow1L4SJjVu44XcLC9CrYqFN4N",
        100000000000000
      ],
      [
        "5C8XbDXdMNKJrZSrQURwVCxdNdk8AzG6xgLggbzuA399bBBF",
        100000000000000
      ],
      [
        "5HinEonzr8MywkqedcpsmwpxKje2jqr9miEwuzyFXEBCvVXM",
        100000000000000
      ],
      [
        "5Ey3NQ3dfabaDc16NUv7wRLsFCMDFJSqZFzKVycAsWuUC6Di",
        100000000000000
      ]
    ]
  },
  "configuration": {
    "config": {
      "approval_voting_params": {
        "max_approval_coalesce_count": 1
      },
      "async_backing_params": {
        "allowed_ancestry_len": 2,
        "max_candidate_depth": 3
      },
      "code_retention_period": 1200,
      "dispute_period": 6,
      "dispute_post_conclusion_acceptance_period": 100,
      "executor_params": [],
      "hrmp_channel_max_capacity": 8,
      "hrmp_channel_max_message_size": 1048576,
      "hrmp_channel_max_total_size": 8192,
      "hrmp_max_message_num_per_candidate": 5,
      "hrmp_max_parachain_inbound_channels": 4,
      "hrmp_max_parachain_outbound_channels": 4,
      "hrmp_recipient_deposit": 0,
      "hrmp_sender_deposit": 0,
      "max_code_size": 3145728,
      "max_downward_message_size": 1048576,
      "max_head_data_size": 32768,
      "max_pov_size": 5242880,
      "max_upward_message_num_per_candidate": 5,
      "max_upward_message_size": 51200,
      "max_upward_queue_count": 8,
      "max_upward_queue_size": 1048576,
      "max_validators": null,
      "minimum_backing_votes": 2,
      "minimum_validation_upgrade_delay": 5,
      "n_delay_tranches": 25,
      "needed_approvals": 2,
      "no_show_slots": 2,
      "node_features": {
        "bits": 8,
        "data": [
          2
        ],
        "head": {
          "index": 0,
          "width": 8
        },
        "order": "bitvec::order::Lsb0"
      },
      "pvf_voting_ttl": 2,
      "relay_vrf_modulo_samples": 2,
      "scheduler_params": {
        "group_rotation_frequency": 20,
        "lookahead": 2,
        "max_availability_timeouts": 0,
        "max_validators_per_core": null,
        "num_cores": 0,
        "on_demand_base_fee": 10000000,
        "on_demand_fee_variability": 30000000,
        "on_demand_queue_max_size": 10000,
        "on_demand_target_queue_utilization": 250000000,
        "paras_availability_period": 4,
        "ttl": 5
      },
      "validation_upgrade_cooldown": 2,
      "validation_upgrade_delay": 2,
      "zeroth_delay_tranche_width": 0
    }
  },
  "registrar": {
    "nextFreeParaId": 2000
  },
  "session": {
    "keys": [
      [
        "5EHZkbp22djdbuMFH9qt1DVzSCvqi3zWpj6DAYfANa828oei",
        "5EHZkbp22djdbuMFH9qt1DVzSCvqi3zWpj6DAYfANa828oei",
        {
          "authority_discovery": "5HbSgM72xVuscsopsdeG3sCSCYdAeM1Tay9p79N6ky6vwDGq",
          "babe": "5Fh6rDpMDhM363o1Z3Y9twtaCPfizGQWCi55BSykTQjGbP7H",
          "beefy": "KWAWRuYGuB7eAXWBsb7ZtaA267AUABJCP45vA7T61bNKG3zMc",
          "grandpa": "5CPd3zoV9Aaah4xWucuDivMHJ2nEEmpdi864nPTiyRZp4t87",
          "para_assignment": "5HQdwiDh8Qtd5dSNWajNYpwDvoyNWWA16Y43aEkCNactFc2b",
          "para_validator": "5CP6oGfwqbEfML8efqm1tCZsUgRsJztp9L8ZkEUxA16W8PPz"
        }
      ],
      [
        "5DvH8oEjQPYhzCoQVo7WDU91qmQfLZvxe9wJcrojmJKebCmG",
        "5DvH8oEjQPYhzCoQVo7WDU91qmQfLZvxe9wJcrojmJKebCmG",
        {
          "authority_discovery": "5HeXbwb5PxtcRoopPZTp5CQun38atn2UudQ8p2AxR5BzoaXw",
          "babe": "5DLjSUfqZVNAADbwYLgRvHvdzXypiV1DAEaDMjcESKTcqMoM",
          "beefy": "KWCXxi2nesB7EUaPMr5oExVcaJ5AmN5adHtWdXeqoEhmMcTK7",
          "grandpa": "5HnDVBN9mD6mXyx8oryhDbJtezwNSj1VRXgLoYCBA6uEkiao",
          "para_assignment": "5ES3fw5X4bndSgLNmtPfSbM2J1kLqApVB2CCLS4CBpM1UxUZ",
          "para_validator": "5EPEWRecy2ApL5n18n3aHyU1956zXTRqaJpzDa9DoqiggNwF"
        }
      ],
      [
        "5FPMzsezo1PRxYbVpJMWK7HNbR2kUxidsAAxH4BosHa4wd6S",
        "5FPMzsezo1PRxYbVpJMWK7HNbR2kUxidsAAxH4BosHa4wd6S",
        {
          "authority_discovery": "5D4r6YaB6F7A7nvMRHNFNF6zrR9g39bqDJFenrcaFmTCRwfa",
          "babe": "5GpZhzAVg7SAtzLvaAC777pjquPEcNy1FbNUAG2nZvhmd6eY",
          "beefy": "KWCGCQqZsnEB4jitvZstHq9dxJE4unuAga5naKmPUUs1oVya8",
          "grandpa": "5HAes2RQYPbYKbLBfKb88f4zoXv6pPA6Ke8CjN7dob3GpmSP",
          "para_assignment": "5CtK7JHv3h6UQZ44y54skxdwSVBRtuxwPE1FYm7UZVhg8rJV",
          "para_validator": "5FtAGDZYJKXkhVhAxCQrXmaP7EE2mGbBMfmKDHjfYDgq2BiU"
        }
      ],
      [
        "5DMNx7RoX6d7JQ38NEM7DWRcW2THu92LBYZEWvBRhJeqcWgR",
        "5DMNx7RoX6d7JQ38NEM7DWRcW2THu92LBYZEWvBRhJeqcWgR",
        {
          "authority_discovery": "5CtgRR74VypK4h154s369abs78hDUxZSJqcbWsfXvsjcHJNA",
          "babe": "5EjkyPCzR2SjhDZq8f7ufsw6TfkvgNRepjCRQFc4TcdXdaB1",
          "beefy": "KW8tZu7Cf6dTjGHR6SwQcoAry4LUVCTq3pzfUNSketjYc8NPC",
          "grandpa": "5DJV3zCBTJBLGNDCcdWrYxWDacSz84goGTa4pFeKVvehEBte",
          "para_assignment": "5F1FZWZSj3JyTLs8sRBxU6QWyGLSL9BMRtmSKDmVEoiKFxSP",
          "para_validator": "5F9FsRjpecP9GonktmtFL3kjqNAMKjHVFjyjRdTPa4hbQRZA"
        }
      ],
      [
        "5C8AL1Zb4bVazgT3EgDxFgcow1L4SJjVu44XcLC9CrYqFN4N",
        "5C8AL1Zb4bVazgT3EgDxFgcow1L4SJjVu44XcLC9CrYqFN4N",
        {
          "authority_discovery": "5DABsdQCDUGuhzVGWe5xXzYQ9rtrVxRygW7RXf9Tsjsw1aGJ",
          "babe": "5Et3tfbVf1ByFThNAuUq5pBssdaPPskip5yob5GNyUFojXC7",
          "beefy": "KW8bmi1qiPmp5x2PAfqBeQ8MdAGWDXo7fYeAAB92oWgXdvXmL",
          "grandpa": "5EX1JBghGbQqWohTPU6msR9qZ2nYPhK9r3RTQ2oD1K8TCxaG",
          "para_assignment": "5CaZuueRVpMATZG4hkcrgDoF4WGixuz7zu83jeBdY3bgWGaG",
          "para_validator": "5EUNaBpX9mJgcmLQHyG5Pkms6tbDiKuLbeTEJS924Js9cA1N"
        }
      ],
      [
        "5C8XbDXdMNKJrZSrQURwVCxdNdk8AzG6xgLggbzuA399bBBF",
        "5C8XbDXdMNKJrZSrQURwVCxdNdk8AzG6xgLggbzuA399bBBF",
        {
          "authority_discovery": "5CZdFnyzZvKetZTeUwj5APAYskVJe4QFiTezo5dQNsrnehGd",
          "babe": "5GHWB8ZDzegLcMW7Gdd1BS6WHVwDdStfkkE4G7KjPjZNJBtD",
          "beefy": "KW2vnN5A1F59icBUNrF3gpcTdDMb8pvYPVACctkGHkdAW3oDB",
          "grandpa": "5GzDPGbUM9uH52ZEwydasTj8edokGUJ7vEpoFWp9FE1YNuFB",
          "para_assignment": "5DnsSy8a8pfE2aFjKBDtKw7WM1V4nfE5sLzP15MNTka53GqS",
          "para_validator": "5CmLCFeSurRXXtwMmLcVo7sdJ9EqDguvJbuCYDcHkr3cpqyE"
        }
      ],
      [
        "5HinEonzr8MywkqedcpsmwpxKje2jqr9miEwuzyFXEBCvVXM",
        "5HinEonzr8MywkqedcpsmwpxKje2jqr9miEwuzyFXEBCvVXM",
        {
          "authority_discovery": "5ELv74v7QcsS6FdzvG4vL2NnYDGWmRnJUSMKYwdyJD7Xcdi7",
          "babe": "5EeCsC58XgJ1DFaoYA1WktEpP27jvwGpKdxPMFjicpLeYu96",
          "beefy": "KWA93sGFQ4a2iMR9DGQt7iQj3NZwKW8mWDZU6gZzU6jYubBMX",
          "grandpa": "5DnEySxbnppWEyN8cCLqvGjAorGdLRg2VmkY96dbJ1LHFK8N",
          "para_assignment": "5HjRTLWcQjZzN3JDvaj1UzjNSayg5ZD9ZGWMstaL7Ab2jjAa",
          "para_validator": "5CAC278tFCHAeHYqE51FTWYxHmeLcENSS1RG77EFRTvPZMJT"
        }
      ],
      [
        "5Ey3NQ3dfabaDc16NUv7wRLsFCMDFJSqZFzKVycAsWuUC6Di",
        "5Ey3NQ3dfabaDc16NUv7wRLsFCMDFJSqZFzKVycAsWuUC6Di",
        {
          "authority_discovery": "5DqAvikdpfRdk5rR35ZobZhqaC5bJXZcEuvzGtexAZP1hU3T",
          "babe": "5H168nKX2Yrfo3bxj7rkcg25326Uv3CCCnKUGK6uHdKMdPt8",
          "beefy": "KW54aj4HK5xHt3eqKqLuPRMDY8kRi4VgKycb3Uq7Bu6fQxqwA",
          "grandpa": "5DrA2fZdzmNqT5j6DXNwVxPBjDV9jhkAqvjt6Us3bQHKy3cF",
          "para_assignment": "5DhDcHqwxoes5s89AyudGMjtZXx1nEgrk5P45X88oSTR3iyx",
          "para_validator": "5Gx6YeNhynqn8qkda9QKpc9S7oDr4sBrfAu516d3sPpEt26F"
        }
      ]
    ]
  },
  "sudo": {
    "key": "5DwBmEFPXRESyEam5SsQF1zbWSCn2kCjyLW51hJHXe9vW4xs"
  }
}
Create a chain-spec from a runtime wasm file
chain-spec-builder -c chainspec.json create -n "Test Chain" -i test-chain -t live -r runtime.wasm patch genesis.json
Verify a chain-spec file
chain-spec-builder verify chainspec.json
Convert a plain chain-spec to raw
chain-spec-builder convert-to-raw chainspec.json > chainspec.raw.json
Infrastructure Tooling References
This section is for listing some useful projects and tools that are relevant for node operators and developers. A community maintained Awesome Substrate is a more detailed general list.
Deployment
| Project | Description |
|---|---|
| Parity Helm Charts collection | Parity & Polkadot Helm charts collection |
| Polkadot Ansible collection | Polkadot Ansible Collection |
Tooling
For an up-to-date list of Polkadot related tooling, check the Polkadot Wiki Tool Index.
Indexing Chain Data
| Project | Description |
|---|---|
| Substrate archive | Blockchain indexing engine using PostgreSQL |
| Subsquid | Blockchain indexing engine using GraphQL |
| SubQuery | Open source GraphQL indexing of any Substrate network (including EVM and WASM smart contract data) directly from the RPC node. SubQuery does not require any preprocessed data making it suitable for fast changing testnets |
CLI Utilities
| Project | Description |
|---|---|
| Subkey | Used for generating and restoring keys. Works with multiple networks and key schemes |
| polkadot-js-tools | A very flexible utility for executing API calls or running queries. |
| Subxt | Submits extrinsics via RPC |
Monitoring
| Project | Description |
|---|---|
| Polkabot | Polkabot is a Matrix chatbot that keeps an eye on the Polkadot network. |
| polkadot-watcher-transaction | The main use case of this application consits of a scanner that can be configured to start from a configured block number, and then it keeps monitoring the on-chain situation delivering alerts to a notifier. |
| polkadot-watcher-validator | The watcher is a nodeJs application meant to be connected with a substrate based node through a web socket. It can then monitor the status of the node, leveraging on mechanisms such as the builtin heartbeat. |
| polkadot-k8s-payouts | Tool that automatically claims your Kusama/Polkadot validator rewards. |